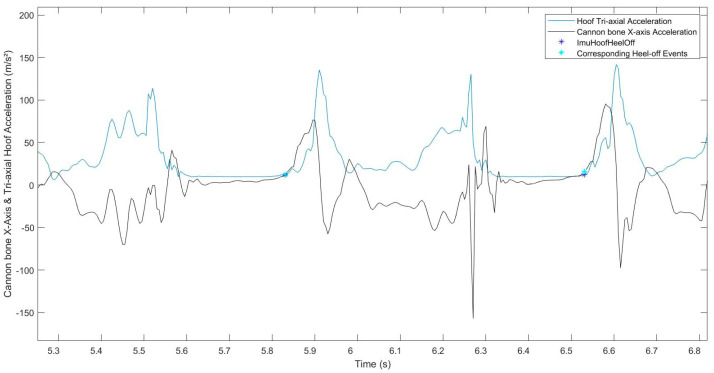
Figure 5.
Representation of the hoof tri-axial acceleration (blue curve) and the cannon bone x-axis acceleration (black curve), for the “forelimb inside the circle” condition. The blue points correspond to the reference heel-off, and the cyan points correspond to the detected heel-off (from the cannon bone IMU data). Unlike all the other conditions, the cannon bone x-axis acceleration shows only one peak at the foot-off moment.

