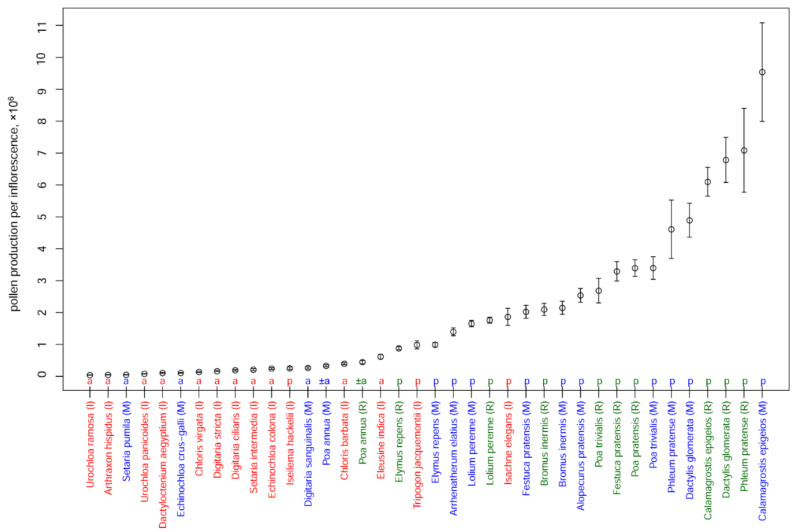
Figure 3.
Pollen production per inflorescence in studied species; n = the number of inflorescences examined in each species. Mean values and their 95% confidence intervals are shown. a, obligate annual; p, perennial. Colors indicate samples from different regions: red (I), India; green (R), Ryazan; blue (M), Moscow.

