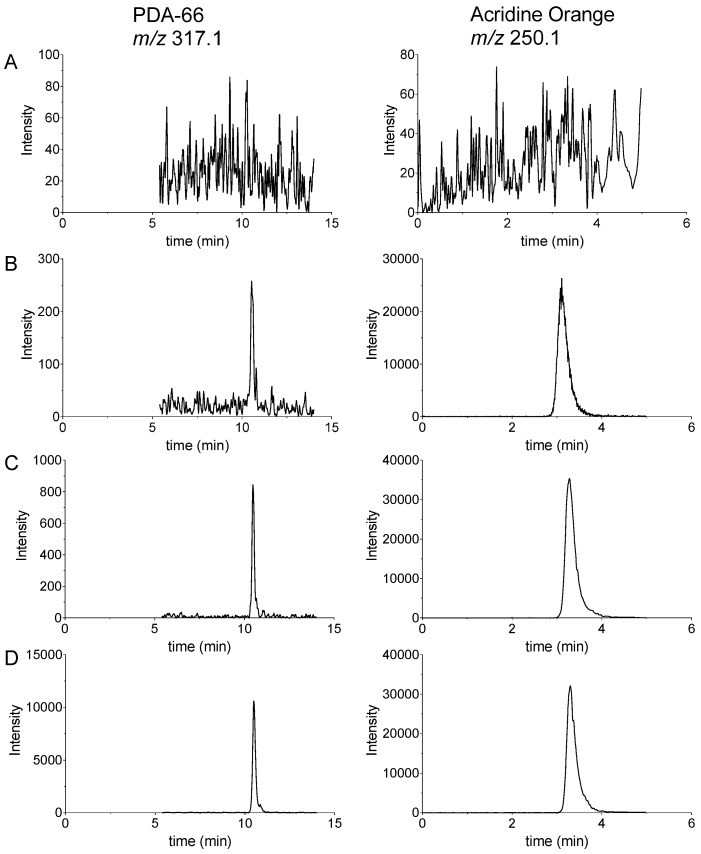
Figure 3.
Chromatograms from LC-MS/MS analysis of (A) a blank sample, (B) a sample containing 2.5 nM PDA-66 (LLOQ), (C) a 7.5 nM PDA-66 standard sample and (D) a 100 nM PDA-66 standard sample. Shown are exemplary chromatograms of the quantification ions for PDA-66 and acridine orange (internal standard). Not shown are the qualifier ions for PDA-66 (m/z 230.2) and the internal standard (m/z 234.1).

