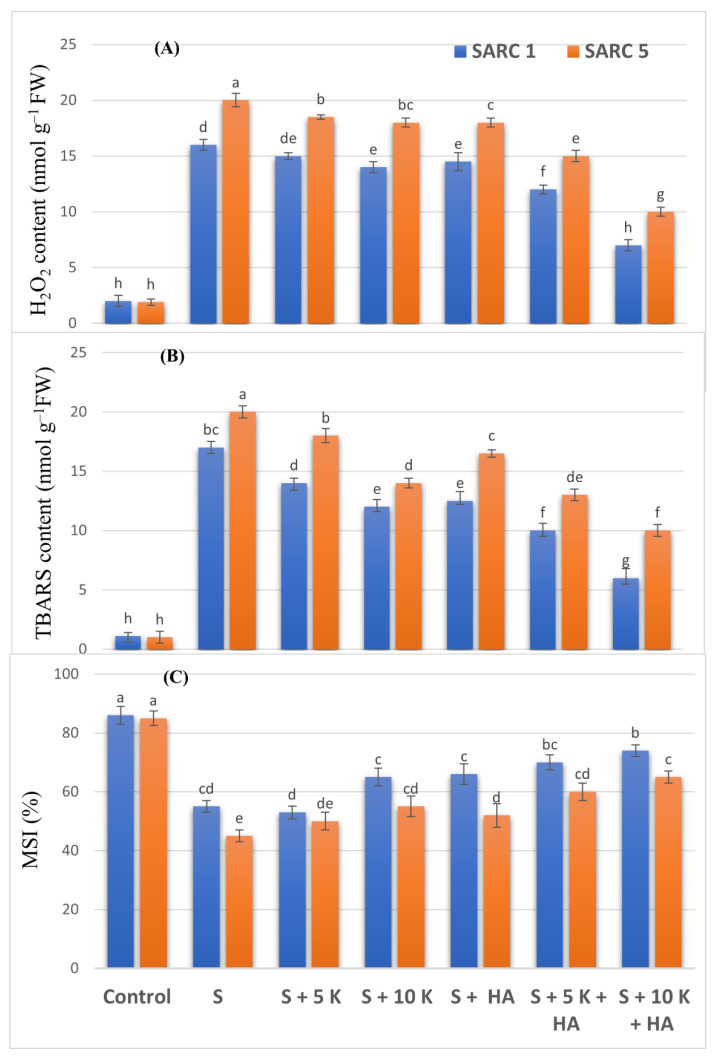
Figure 4.
Effect of potassium (5, 10 mM K) and humic acid (HA, 2 g kg−1) on H2O2 contents (A), TBARS contents (B) and membrane stability index (C) of salt tolerant (SARC 1) and salt sensitive (SARC 5) wheat genotypes exposed to 100 mM NaCl salt stress (S). FW, fresh weight; TBARS, thiobarbituric acid reactive substances; MSI, membrane stability index. For each trait, bar data with the same letter indicate no significant difference between treatments (p < 0.05).

