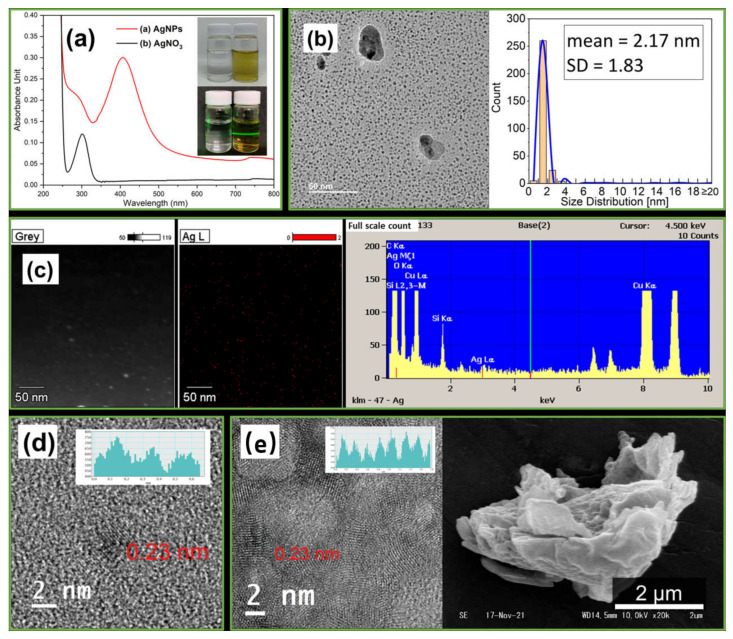
Figure 4.
(a) UV-Vis and Tyndall Effect photograph of AgNO3 feed solution and AgNPs product solution. (b) TEM images and size dispersion of AgNPs. (c) EDS mapping and spectrum of AgNPs. (d) HRTEM lattice lines of the primary particles of AgNPs. (e) HRTEM Lattice lines and SEM images of freeze-dried agglomerated secondary particles of starch-capped AgNPs.

