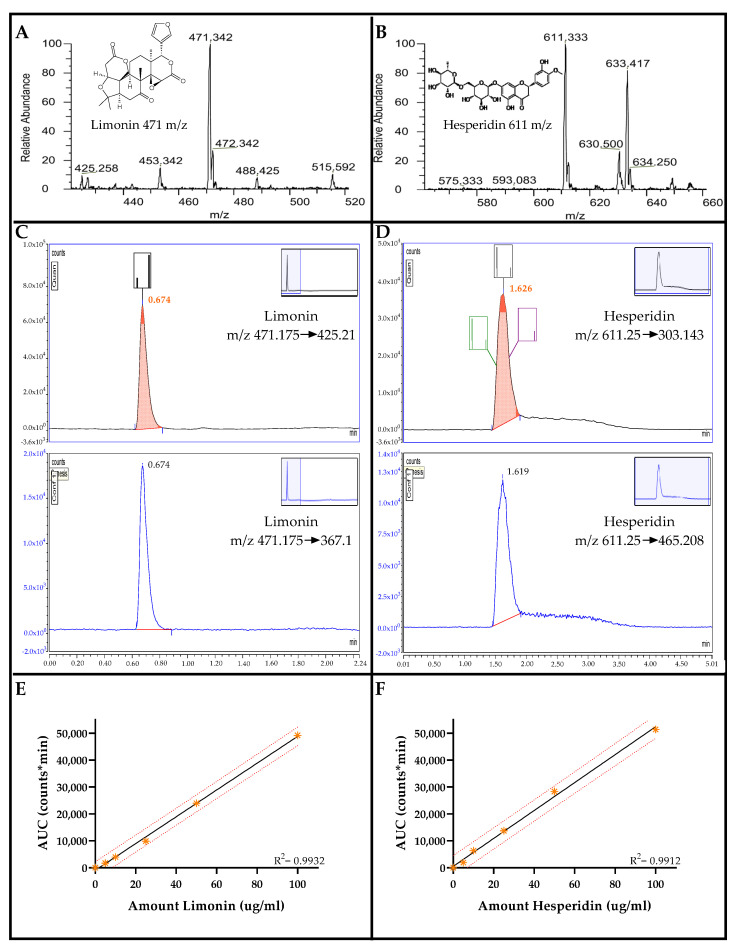
Figure 1.
Reference compounds analyzed by UHPLC-MS/MS. Precursor MS spectra of limonin (A) and hesperidin (B). Chromatograms for quantified (upper) and confirmed (lower) product ions of limonin (C) and hesperidin (D). Retention times are shown as a red number above the quantified peaks. Average calibration curves of limonin (E) and hesperidin (F) generated by the linear plots between areas under the curves of the quantitative product ions and the concentrations of standard solutions. R2 values were obtained from linear regression.

