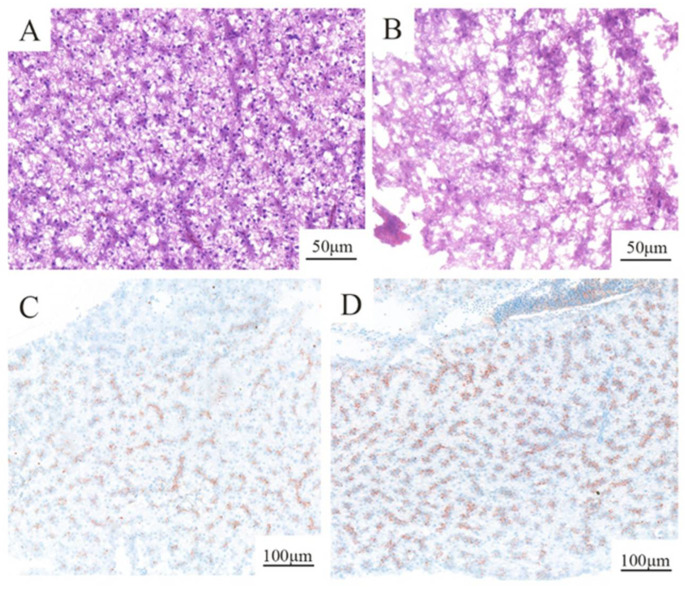
Figure 1.
Liver tissues of rare minnow. (A,C) Normal appearance of the control liver. (B) The liver was exposed to 200 μg/L MPs solution showing cell hypertrophy and increased vacuolization in hepatocytes compared with the control. (D) The liver exposed to 200 μg/L MPs shows a larger area and daker color of the lipid droplets than the control.

