Fig. 4.
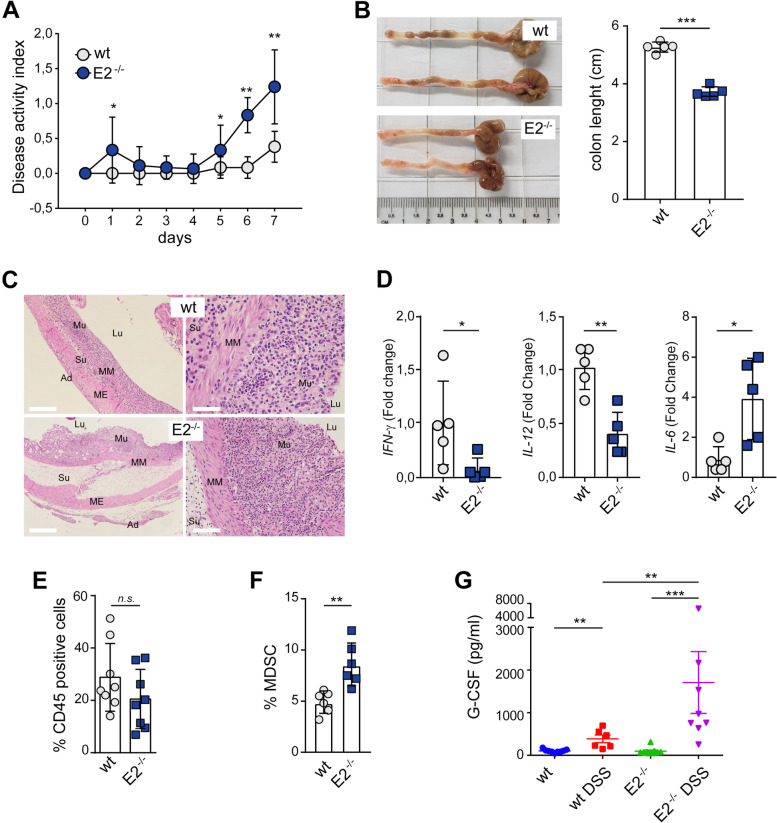
EMILIN-2 loss associates with an immune supressive microenvironment. A Graph showing the Disease Activity Index (DAI) of wild type (wt) and Emilin-2−/− (E2−/−) mice during DSS administration, n = 5. B Representative images and graph reporting the length of wild type (wt) and Emilin-2−/− (E2−/−) colons at day 7 of the experiment reported in A. C Representative H&E images of the colonic mucosa of wild type (wt) and Emilin-2−/− (E2−/−) mice after 7 days of DSS administration; magnification: left images 50x (scale bar = 500 μm); right images: 200x (scale bar = 125 μm). Lu: Lumen; Mu: Mucosa; MM: Muscularis mucosa; Su: Submucosa; ME: Muscularis externa; Ad: Adventitia. D qPCR evaluation of the expression of Interferon-γ (IFN-γ), Interleukin-12 (IL-12) and Interleukin-6 (IL-6) relative to that of GAPDH, in colonic samples from wild type (wt) and Emilin-2−/− (E2−/−) mice after 7 days of DSS administration; n = 5. E Flow cytometry analyses of total leukocytes (% CD45+/total cells) infiltrating the wild type (wt) and Emilin-2−/− (E2−/−) colonic mucosa after 7 days of DSS administration, assessed as percentage of CD45 positive cells; n = 8. F Evaluation of total Myeloyd Derived Suppressor Cells (MDSC) in the wild type (wt) and Emilin-2−/− (E2−/−) colonic mucosa after 7 days of DSS administration, assessed by flow cytometry as percentage of CD11b+Gr1+ cells on CD45 positive cells; n = 6. G Graph indicating the concentration of G-CSF in sera from wild type (wt) and Emilin-2−/− (E2−/−) mice treated or not with DSS for 7 days; n = 8. Graphs represent the mean ± SD; in A, B, D, E and F, P values were obtained using the paired Student’s t-test; in G, P values were obtained with the One Way Anova Test; * P < 0.05, **P < 0.01, ***P < 0.001, n.s.: P > 0.05

