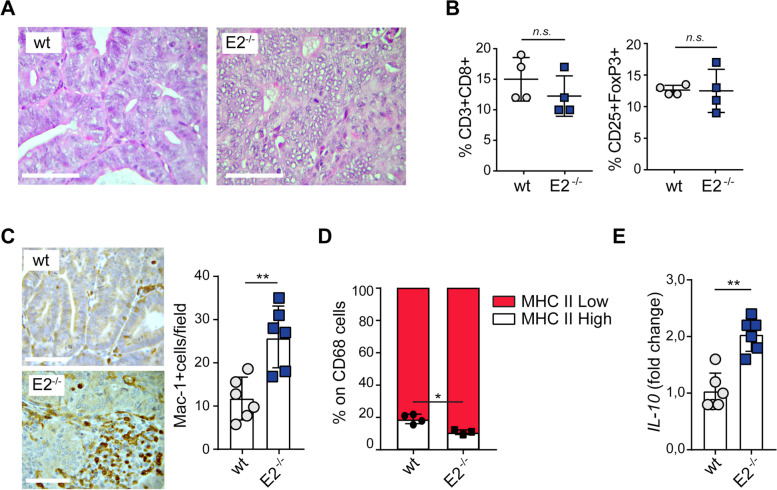
Fig. 5.
Emilin-2−/− mice display an altered tumor associated inflammatory response. A Representative H&E images of tumors developed in wild type (wt) and Emilin-2−/− (E2−/−) mice treated with AOM and DSS; magnification 400x; scale bar = 50 μm. B Analyses of cytotoxic T cells (left, CD3 + CD8+) and Treg cells (right, CD4+CD25+Foxp3+) infiltrating the tumors from wild type (wt) and Emilin-2−/− (E2−/−) mice, assessed as percentage of CD3+ cells by flow cytometry; n = 4. C Representative images and quantification of macrophages (Mac-1 positive cells) infiltrating the tumors developed in wild type (wt) and Emilin-2−/− (E2−/−) mice; n = 6; magnification 400x; scale bar = 50 μm. D Evaluation of the percentage of CD68+ cells expressing high or low levels of MHC II in tumors from wild type (wt; n = 4) and Emilin-2−/− (E2−/−; n = 3) mice, as assessed by flow cytometry. E qPCR evaluation of the expression of Interleukin-10 (IL-10) relative to that of GAPDH, in tumors from wild type (wt) and Emilin-2−/− (E2−/−) mice; n = 6. Graphs represent the mean ± SD; P values were obtained using the paired Student’s t-test; * P < 0.05, **P < 0.01, n.s.: P > 0.05

