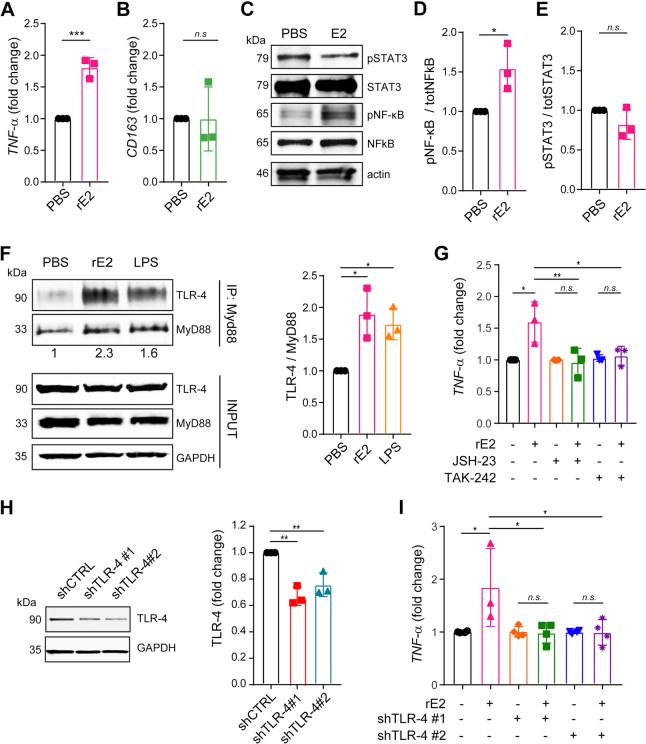
Fig. 7.
EMILIN-2 triggers TLR-4 activation promoting M1 polarization. A qPCR analyses of the expression of TNF-α (M1 marker) relative to GAPDH in TPA-activated THP-1 cells upon IFN-γ/LPS treatment in the presence of recombinant EMILIN-2 (rE2) or vehicle (PBS); n = 3. B qPCR analyses of the expression of CD163 (M2 marker) relative to GAPDH in TPA-activated THP-1 cells upon IL-4 treatment in the presence of recombinant EMILIN-2 (rE2) or vehicle (PBS); n = 3. C Western blot analyses of pSTAT3 and pNF-κB in TPA-activated THP-1 cells challenged with recombinant EMILIN-2 (rE2) or vehicle (PBS); n = 3. D and E Quantification of the results reported in C. F Left: Western blot analyses of TLR-4 immunoprecipitation with the anti-MyD88 antibody using TPA-activated THP-1 cells challenged with recombinant EMILIN-2 (rE2), vehicle (PBS) or LPS as positive control. Whole lysates were loaded as input. Right: quantification of TLR-4 from three different experimental replicates. G qPCR analyses of the expression of TNF-α relative to GAPDH in TPA-activated THP-1 cells w/wo recombinant EMILIN-2 (rE2), and/or the TLR-4 (TAK-242) and NF-κB (JSH-23) inhibitors; n = 3. H Western blot (left) and quantification (right) of the down-regulation of TLR-4 upon lentiviral transduction with two specific shRNA constructs; pLKO served as a shRNA control (shCTRL). I qPCR analyses of TNF-α expression relative to that of GAPDH in TPA-activated THP-1 cells treated or not with recombinant EMILIN-2 (rE2) upon downregulation of TLR-4. Graphs represent the mean ± SD; P values were obtained using the paired Student’s t-test (A, B, D and E) or the One Way Anova Test (F, G, H and I); * P < 0.05, **P < 0.01, ***P < 0.001, n.s.: P > 0.05

