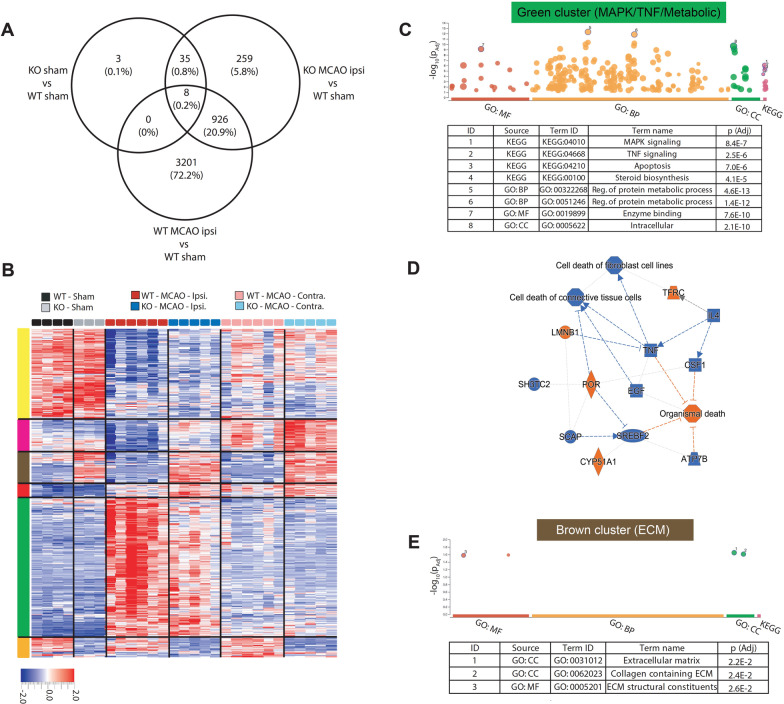
Fig. 4.
Lack of CD36 alters gene expression response in the CP of neonatal mice 3 h after tMCAO. A Venny diagram showing the number of differentially expressed genes (q < 0.05) and the number/percentage of genes shared between different analyses. B Gene clustering and heat map of top 1000 genes significantly (q < 0.05) different between groups. C gProfiler gene ontology graphs and top GO terms related to the green cluster. D Ingenuity Pathway Analysis (IPA) showing a network of pathways and key regulators related to genes in the green cluster and top canonical pathways. Only genes that are significantly different between WT and CD36 KO ipsilateral CP in the green cluster were included in IPA analysis. E gProfiler gene ontology graphs and top GO terms related to the brown cluster. KO CD36 KO, WT wild type, Ipsi ipsilateral, Contra contralateral, CC cellular component, BP biological process, MF molecular function

