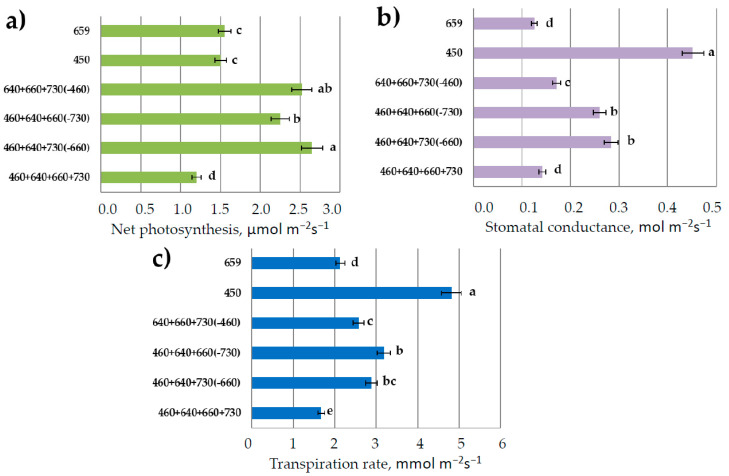
Figure 5.
CO2—H2O leaf exchange in lettuce plants in response to various light treatments. (a) Net photosynthesis; (b) stomatal conductance; (c) transpiration rate. Means ± standard error (SE); means followed by the same letter were not different at p ≤ 0.05. For light treatments legend see Figure 4.

