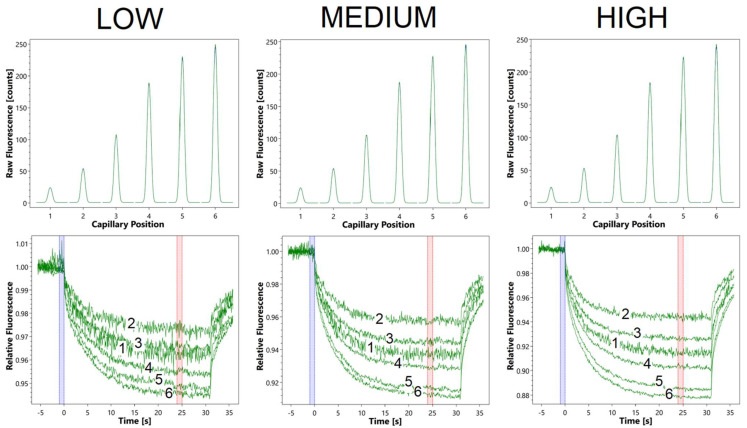
Figure 2.
Data collected during the FITC analysis using the MST instrument; (top)—initial fluorescence intensity before turning on the IR laser for buffers with different pH: 1-pH 5.38, 2-pH 5.86, 3-pH 6.52, 4-pH 7.12, 5-pH 7.80, 6-pH 9.42; (bottom)—change of fluorescence over time from turning on the IR laser depending on pH, in the same buffers, with different IR laser powers: low, medium and high. The blue and red bars indicate the data used to calculate the MST response—a quantitative parameter for the further analysis (pKa determination).

