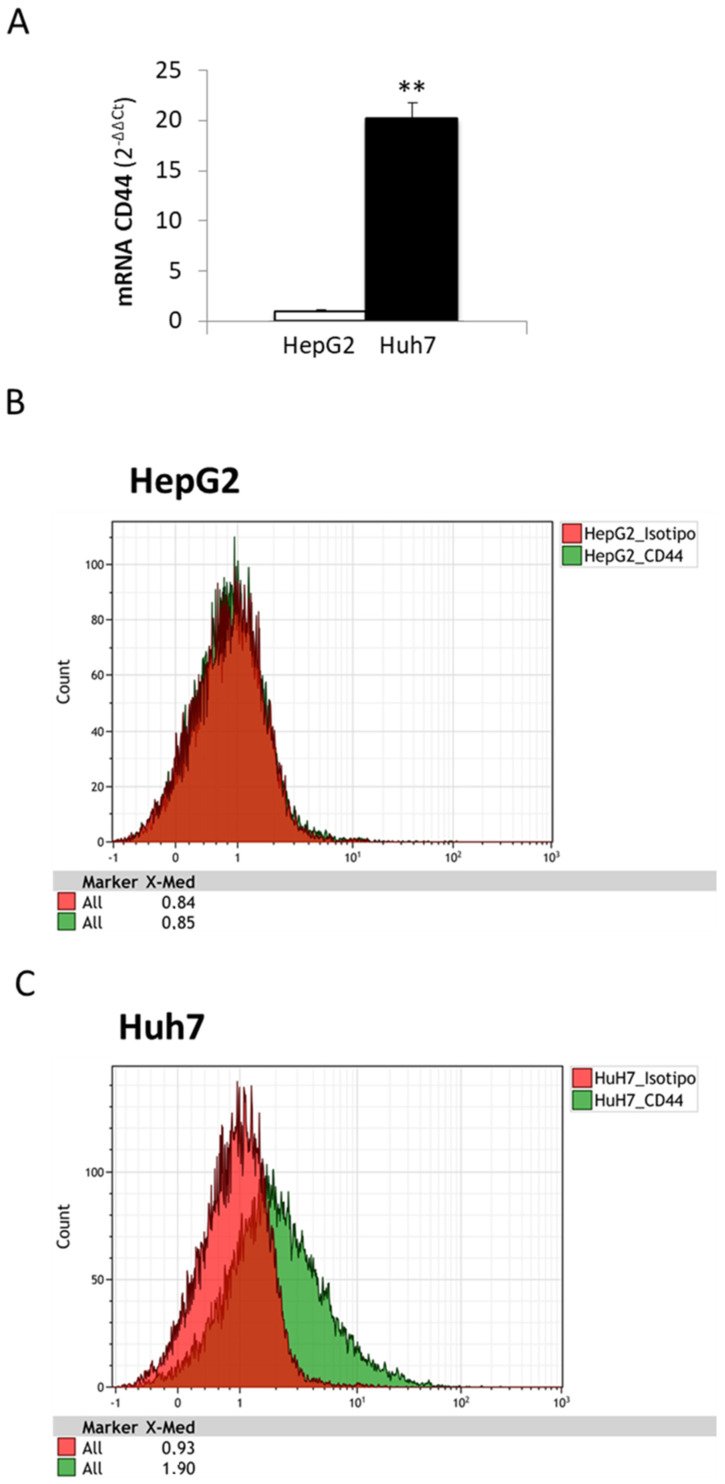
Figure 2.
(A–C) In vitro expression of CD44 in liver cancer cell lines. (A). Comparison of CD44 mRNA levels in HepG2 and Huh7 using qPCR. Data in graphs are expressed as means ± SD (** p < 0.01). (B,C) Flow cytometry analysis of CD44 expression on plasma membranes of HepG2 (B) and Huh7 (C). Isotype-matched antibody (isotype) was used as the control.

