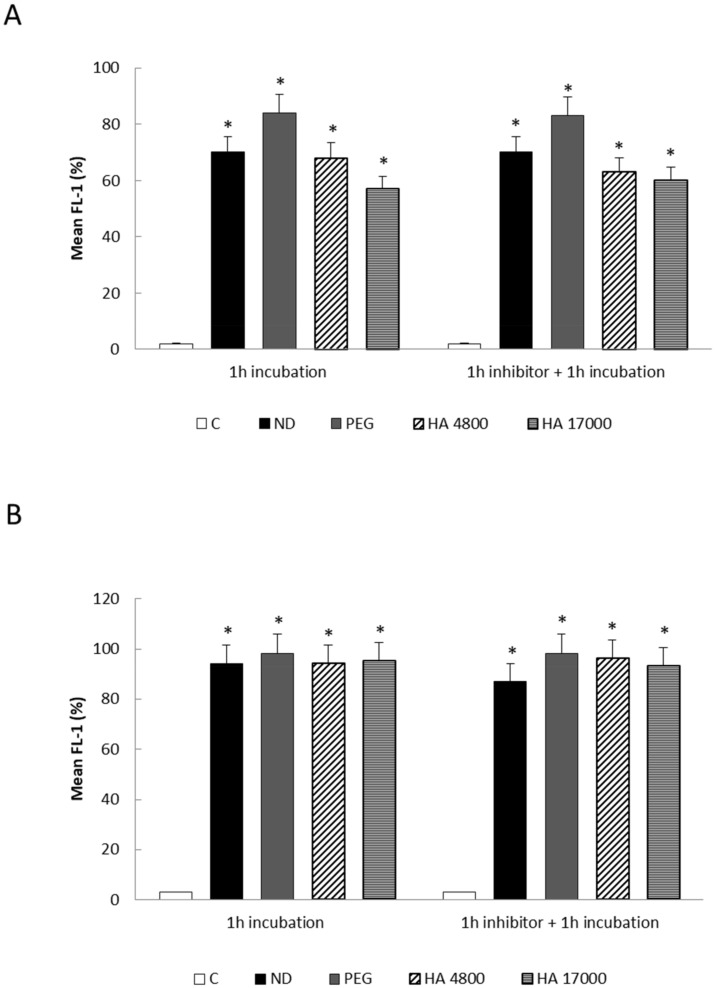
Figure 6.
(A,B) Cellular uptake of different formulations of fluorescein-5-isothiocyanate (FITC) labeled liposomes in THP-1 (A) and RAW 264.7 (B) cells in the presence of HA inhibitor. The internalization of fluorescent liposomes was evaluated by flow cytometry in THP-1 and RAW 264.7 cells after 1 h pre-incubation with an HA inhibitor (HA 51000). C = control; ND = non-decorated liposomes; PEG = liposomes decorated with PEG (polyethylene glycol); HA 4800 = liposomes decorated with low molecular weight HA; HA 17000 = liposomes decorated with high molecular weight HA. Data in graphs are expressed as means ± S.D of three independent experiments. * p < 0.001 vs. control.

