
Figure 2.
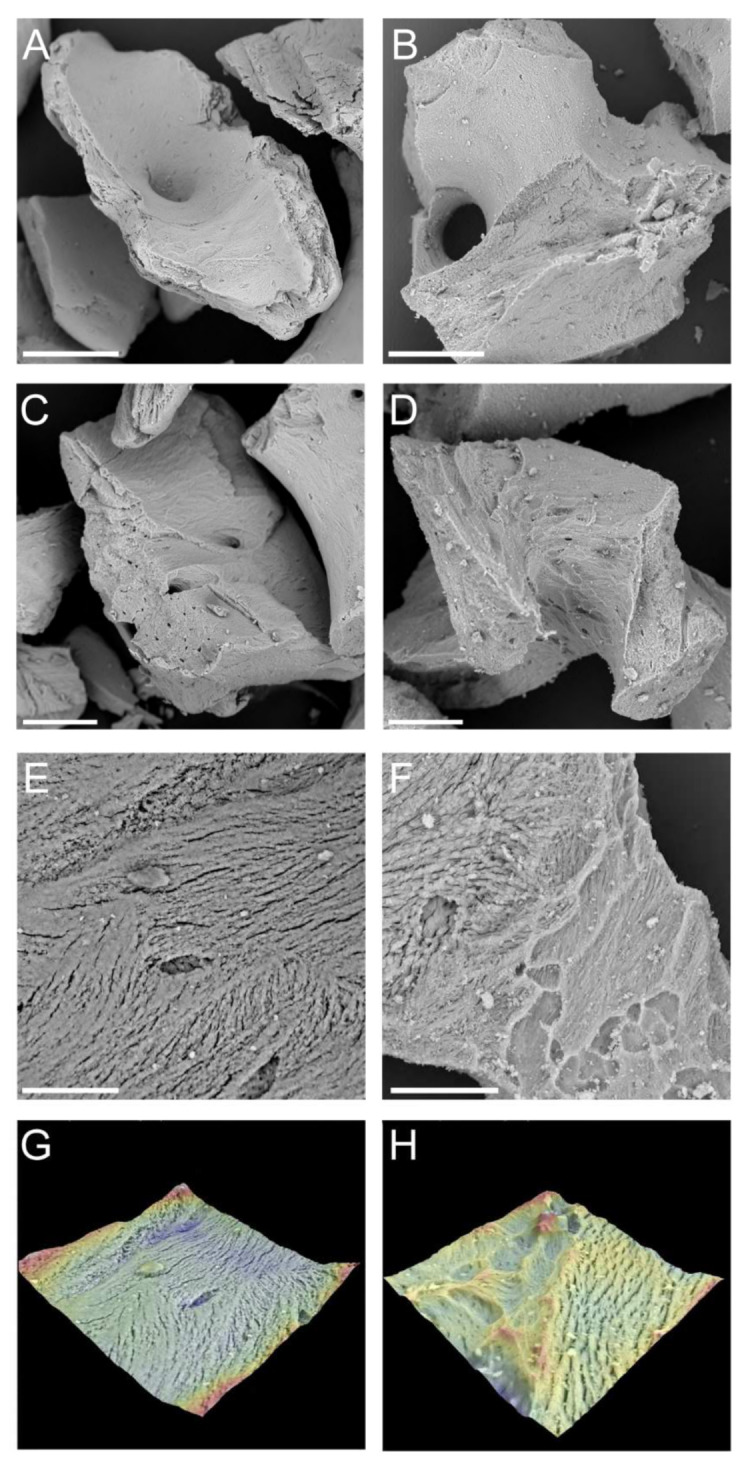
SEM images (A–F) and 3D surface reconstruction (G,H) of AEB (A,C,E,G) and ABB (B,D,F,H). Scale bars: (A,B): 200 μm; (C,D): 100 μm; (E,F): 30 μm.
Official websites use .gov
A
.gov website belongs to an official
government organization in the United States.
Secure .gov websites use HTTPS
A lock (
) or https:// means you've safely
connected to the .gov website. Share sensitive
information only on official, secure websites.
SEM images (A–F) and 3D surface reconstruction (G,H) of AEB (A,C,E,G) and ABB (B,D,F,H). Scale bars: (A,B): 200 μm; (C,D): 100 μm; (E,F): 30 μm.