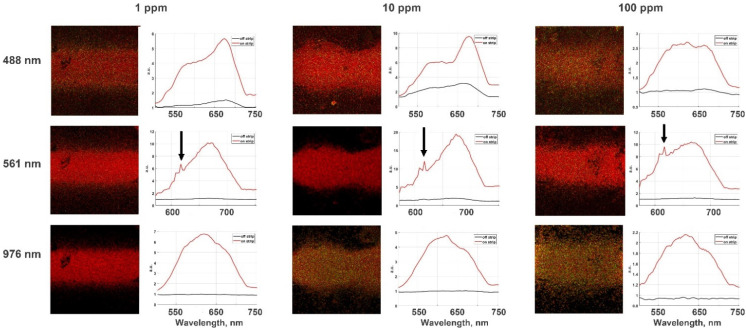
Figure 7.
Luminescence spectra exited by 488, 561 (LED), and 976 nm (two-photon excitation by a femtosecond laser) on films with different amount of RhB (1, 10, and 100 ppm) in MG; the arrow marks the Raman bands for a Raman shift of 561 nm. The black lines indicate a luminescent signal on the dye’s mixture outside the strip, while the red lines on PL spectra show the PL signal of dye mixtures under the gold nanoparticles.

