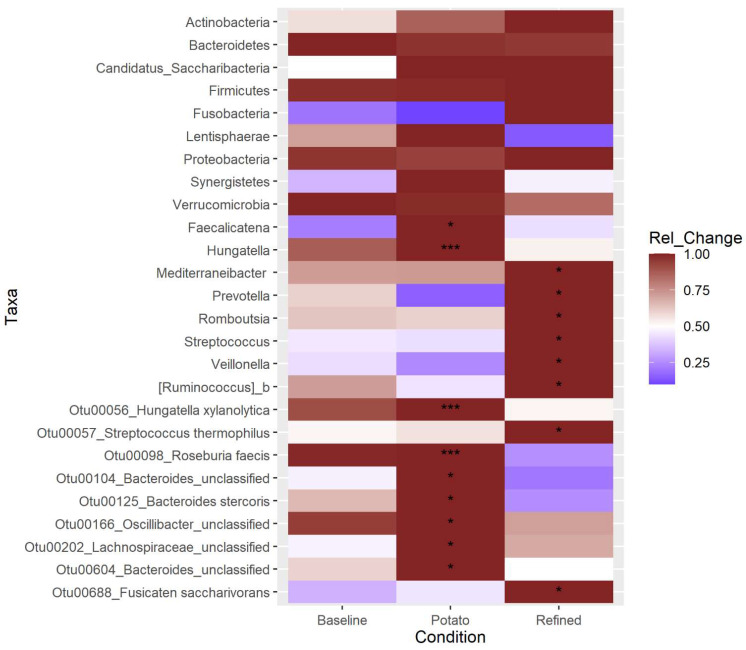
Figure 4.
Differential abundance analysis. The heatmap is colored by the standardized change in the relative abundance of the taxon between the baseline and each of the diet conditions. Significant differences were calculated by three methods: LEfSe, DESeq2, and ANCOM-II. Significance is indicated by * for one method finding the taxon significantly different between that treatment and the control, *** for all three methods detecting a significant change. For LEfSe and DESeq2, adjusted p-values of 0.05 were used as the cutoff for significance, while for ANCOM-II, which does not generate p-values, the default cutoff threshold of 0.7 was used.

