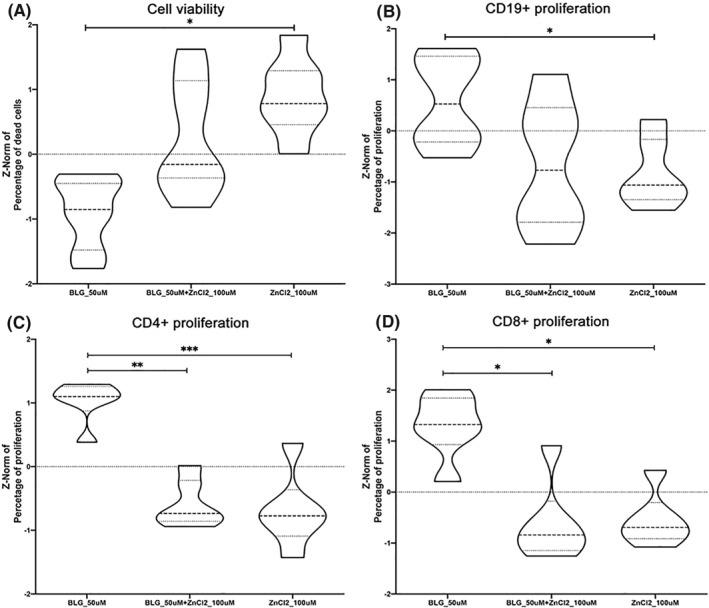
FIGURE 5.

Cellular responses to BLG alone, zinc complexed with BLG, or zinc alone, studying PHA‐stimulated PBMC from healthy donors (n = 6). (A) Cell viability after stimulation with apo‐BLG (BLG_50 μM), zinc‐BLG (BLG_50 μM + zinc chloride (ZnCl2)_100 μM) or ZnCl2 (100 μM). Proliferation of PHA‐stimulated (B) CD19+, (C) CD3+CD4+ cells and (D) CD3+CD8+ cells. Mean of three independent experiments is shown. Statistical comparison of z‐normalized data was performed between three stimulation conditions (medium control was not different from apo‐BLG, data not shown): *p < 0.05, **<p < 0.01, ***p < 0.001. Representation as violin plots (wider parts represent values occurring at higher frequency; narrower parts represent values occurring at lower frequency; dotted line represents median, grey lines represent interquartile ranges)
