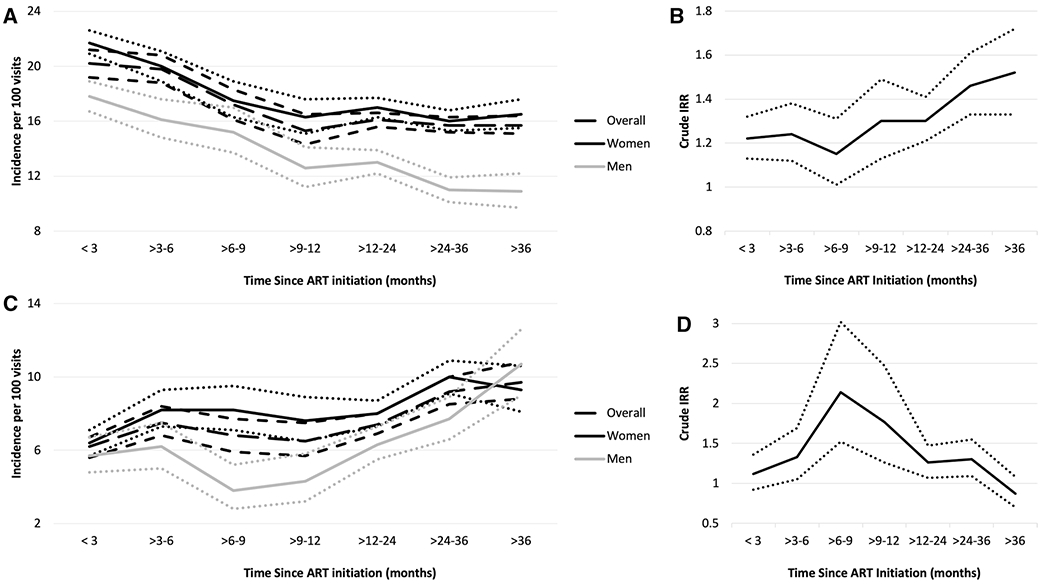
Fig. 2.

Panels A and C: Crude incidence rate1,3 of patient transfers by time from ART initiation, overall and by gender. Panels B and D: Crude IRR and 95% CIs2,4 of patient transfers comparing women to men. Panels A and B include all visits, whereas panels C and D include recorded HIV visits only. Dotted or short dashed lines represent 95% CIs. 1 Number of patient transfers over number of healthcare visits by time from ART initiation (all visits): < 3 months: 1,478/7,329; > 3–6 months: 1,446/7,316; > 6–9 months: 919/5,355; > 9–12 months: 770/5,022; > 12–24 months: 3,432/21,323 > 24–36 months: 3,296/20,976; > 36 months: 2,478/15,739. 2 Crude IRR, women vs. men (95% CI) by time from ART initiation (all visits): < 3 months: 1.22 (1.13, 1.32); > 3–6 months: 1.24 (1.12, 1.38); > 6–9 months: 1.15 (1.01, 1.31); > 9–12 months: 1.30 (1.13, 1.49); > 12–24 months: 1.30 (1.21, 1.41); > 24–36 months: 1.46 (1.33, 1.61); > 36 months: 1.52 (1.33, 1.72). 3 Number of patient transfers over number of healthcare visits by time from ART initiation (recorded HIV visits only): < 3 months: 495/8,045; > 3–6 months: 355/4,706; > 6–9 months: 213/3,154; > 9–12 months: 206/3,148; > 12–24 months: 736/9,930; > 24–36 months: 628/6,821; > 36 months: 354/3,632. 4 Crude IRR, women vs. men (95% CI) by time from ART initiation (recorded HIV visits only): < 3 months: 1.12 (0.92, 1.36); > 3–6 months: 1.33 (1.05, 1.69); > 6–9 months: 2.14 (1.52, 3.02); > 9–12 months: 1.77 (1.26, 2.47); > 12–24 months: 1.26 (1.07, 1.47); > 24–36 months: 1.30 (1.09, 1.55); > 36 months: 0.87 (0.70, 1.08)
