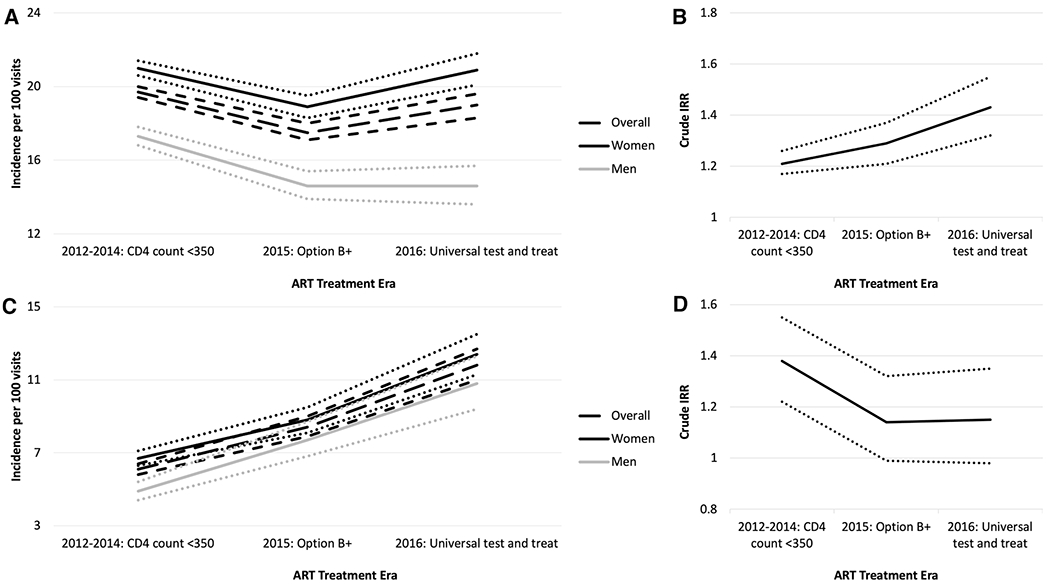
Fig. 3.

Panels A and C: Crude incidence rate1,3 of patient transfers by ART treatment area, overall and by gender. Panels B and D: Crude IRR and 95% CIs2,4 comparing women to men by ART treatment era. Panels A and B include all visits, whereas panels C and D include recorded HIV visits only. Dotted or short dashed lines represent 95% CIs. 1 Overall number of patient transfers over number of healthcare visits by ART treatment era (all visits): 2012–2014: 15,975/81,169; 2015: 5,217/29,775; 2016: 3,224/16,990. 2 Crude IRR, women vs. men (95% CI) by ART treatment era (all visits): 2012–2014: 1.21 (1.17, 1.26); 2015: 1.29 (1.21, 1.37); 2016: 1.43 (1.32, 1.55). 3 Overall number of patient transfers over number of healthcare visits by ART treatment era (recorded HIV visits only): 2012–2014: 1,383/22,783; 2015: 909/10,777; 2016: 695/5,876. 4 Crude IRR, women vs. men (95% CI) by ART treatment era (recorded HIV visits only): 2012–2014: 1.38 (1.22, 1.55); 2015: 1.14 (0.99, 1.32); 2016: 1.15 (0.98, 1.35)
