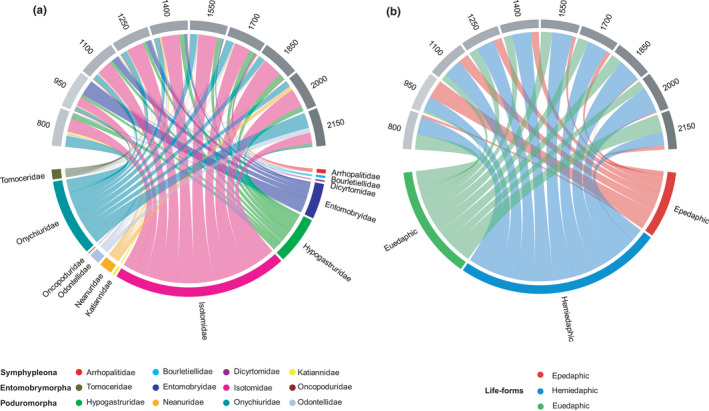
FIGURE 3.

Relative abundance (% of total) of families (a) and life‐forms (b) of Collembola (lower half circle) at 10 altitudes along an altitudinal gradient spanning from 800 to 2150 m at Changbai Mountain (upper half circle). The width of the links represents the relative abundance of families and life‐forms at the respective altitude
