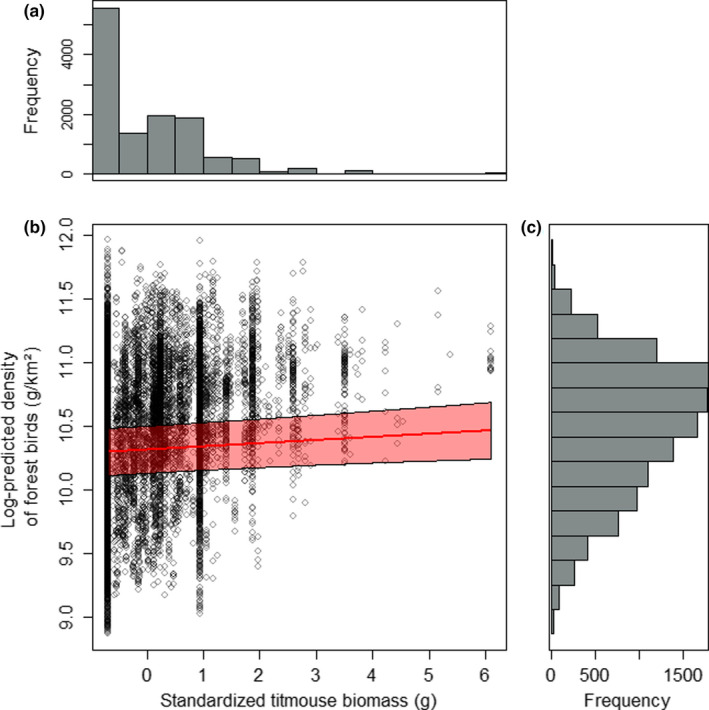
FIGURE 1.

Frequency distribution of standardized titmouse abundance (given as biomass; g) in Finland (a). The relationship between log‐predicted density of forest birds (g/km2) and standardized titmouse abundance (given as biomass; g) in Finland in 2001 (i.e., first study year; β = 10.315, γ 1 = 0.025; see Table 1 for definition of all symbols) (b). Circles are predicted forest bird densities for the sampling points and the fitted line with 95% confidence intervals derives from the spatial Gompertz model (see Section 2.3 for details) visualizing the linear relationship between predicted forest bird density and titmouse abundance. There was minor variance among years in the intercept (10.184 < β < 10.418), so the elevation of the line varies among years, but the slope remains the same. Frequency distribution of log‐predicted density of forest birds (g/km2) in Finland (c)
