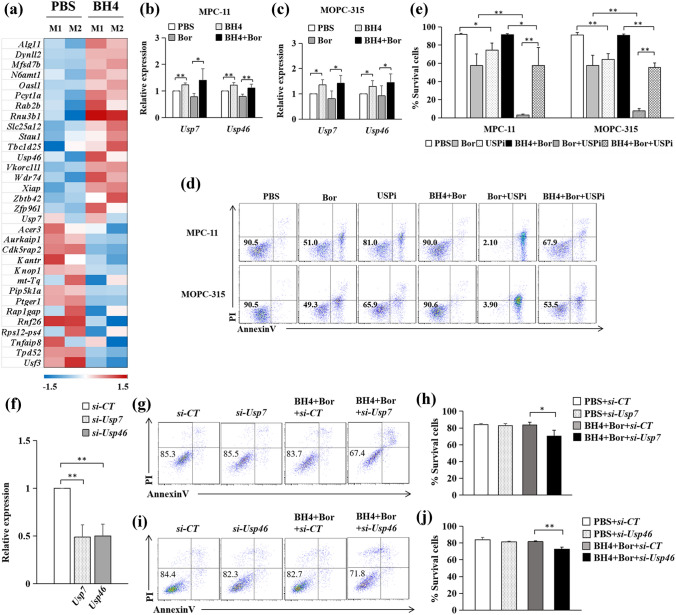
Fig. 3.
BH4 increases MM cell survival via USP7 and USP46. a MPC-11(M1) and MOPC-315(M2) were cultured with or without (PBS) the addition of BH4 for 24 h. Cells were analyzed by RNA-seq. Pink-blue heatmap shows the log2-fold change of the differentially expressed genes. Pink, higher expression; blue, lower expression. b, c MPC-11 (b) and MOPC-315 (c) were cultured in the presence or absence (PBS) of BH4, Bor, or their combinations (BH4 + Bor) for 24 h. qPCR assessed the mRNA levels of Usp7 andUsp46. Expression was normalized to Gapdh and set at 1 in PBS-treated cells. Results shown are the mean ± SD of three independent experiments. d MPC-11 and MOPC-315 cells were cultured in the presence or absence (PBS) of Bor, P22077(USP inhibitor, USPi), BH4 + Bor, Bor + USPi, or their combinations (BH4 + Bor + USPi). Cell apoptosis were analyzed by flow cytometry. Numbers in the dot plots represent viability of MM cells. Showing are representative data of three independent experiments. e Summarized results of three independent experiments obtained as (d). f MPC-11 were treated by Usp7 (si-Usp7), Usp46 (si-Usp46), or control siRNA (si-CT) for 24 h. qPCR assessed mRNA levels of Usp7 and Usp46. g, h MPC-11 treated with si-Usp7 or si-CT were cultured in the presence of BH4 + Bor combinations for 24 h. Cell apoptosis were analyzed by flow cytometry (g). Numbers in the dot plots represent viability of MM cells. Showing are representative data of three independent experiments (h). i, j MPC-11 treated with si-Usp46 or si-CT were cultured in the presence of BH4 + Bor combinations for 24 h. Cell apoptosis were analyzed by flow cytometry (i). Numbers in the dot plots represent viability of MM cells. Showing are representative data of three independent experiments (j). Data are presented as mean ± SD. *P < 0.05; **P < 0.01

