Fig. 2.
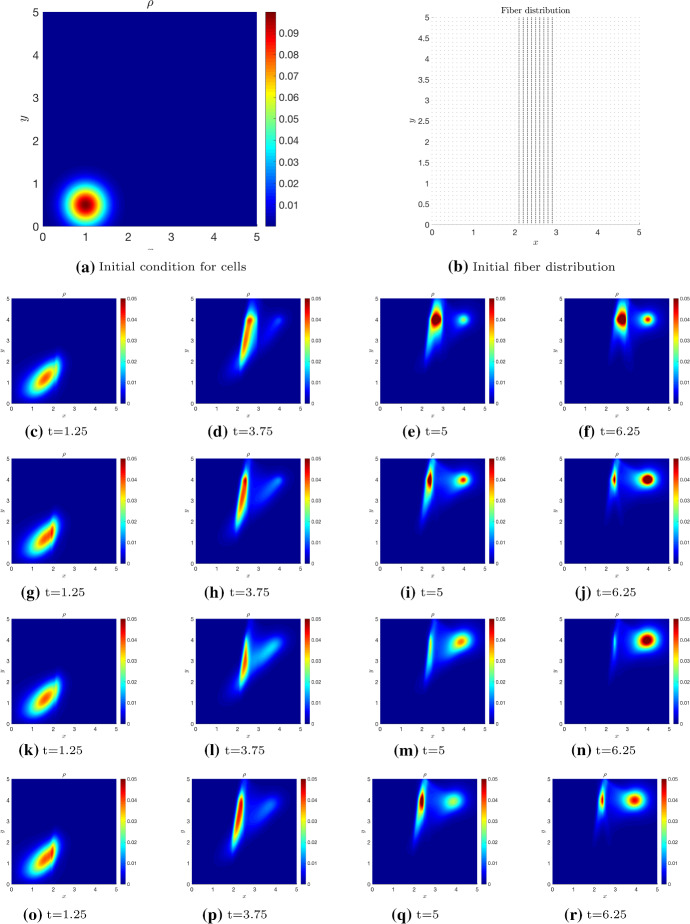
Test 2 Time evolution of the initial distribution given in Fig. 2a in the four settings 1-4. The sensing radius of the cells is and is (72) with and . Setting 1 is represented in Figs. (c–f): local q and non-local , . Setting 2 is represented in Figs. (g–j): non-local q and with sensing functions . Setting 3 is represented in Figs. (k–n): non-local q and , independent sensing with . Setting 4 is represented in Figs. (o–r): non-local q and , dependent sensing with (color figure online)

