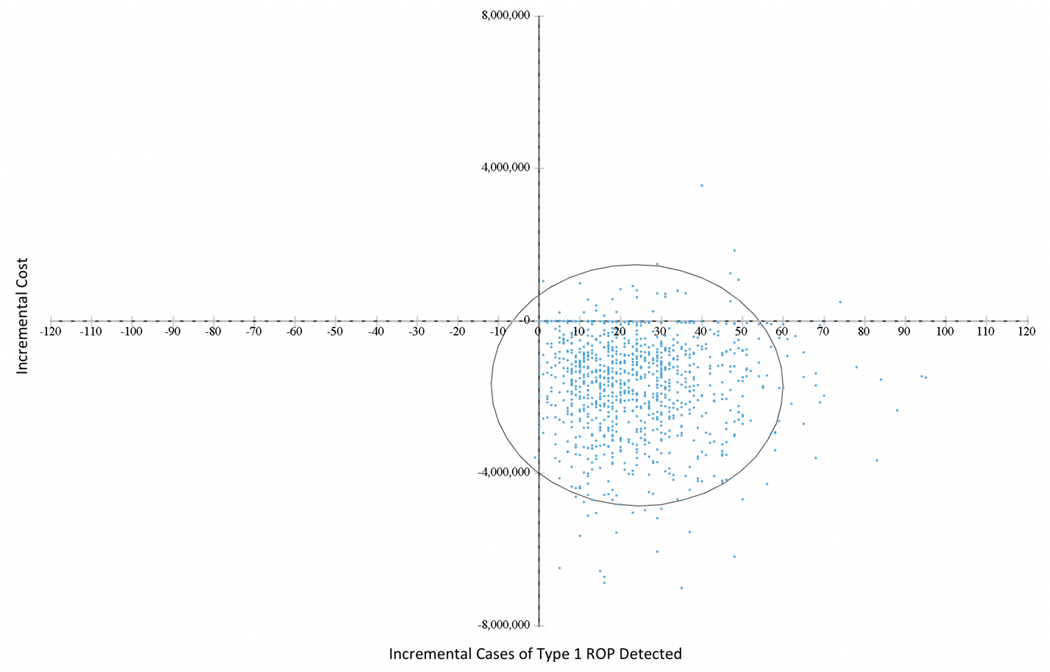
Figure 2.
Differences in mean costs and effects between Conventional Screening and G-ROP screening cohorts for the base case (Discharge), cost per case of Type 1 ROP detected. Each point represents one run of the simulation model as described in the text. Ellipse represents 95% confidence bound for joint distribution of cost and effectiveness.

