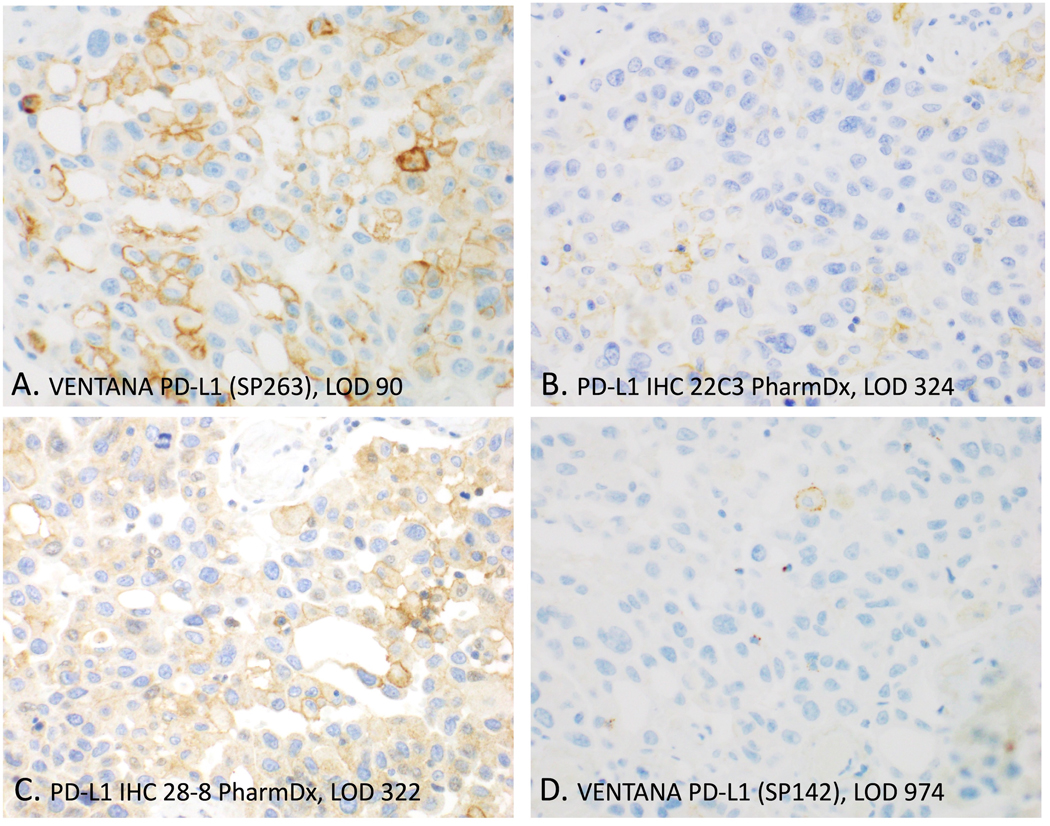
Fig. 3. Photomicrographs of PD-L1 staining on 4 commercial assays.

These are serial sections of the same tissue sample and stained by the reference labs (red diamonds of Fig. 1). Overall, high analytic sensitivity (as represented by low LODs) was associated with more PD-L1 positive cells and stronger staining. LODs are x1000 molecules PD-L1 per cell equivalent.
