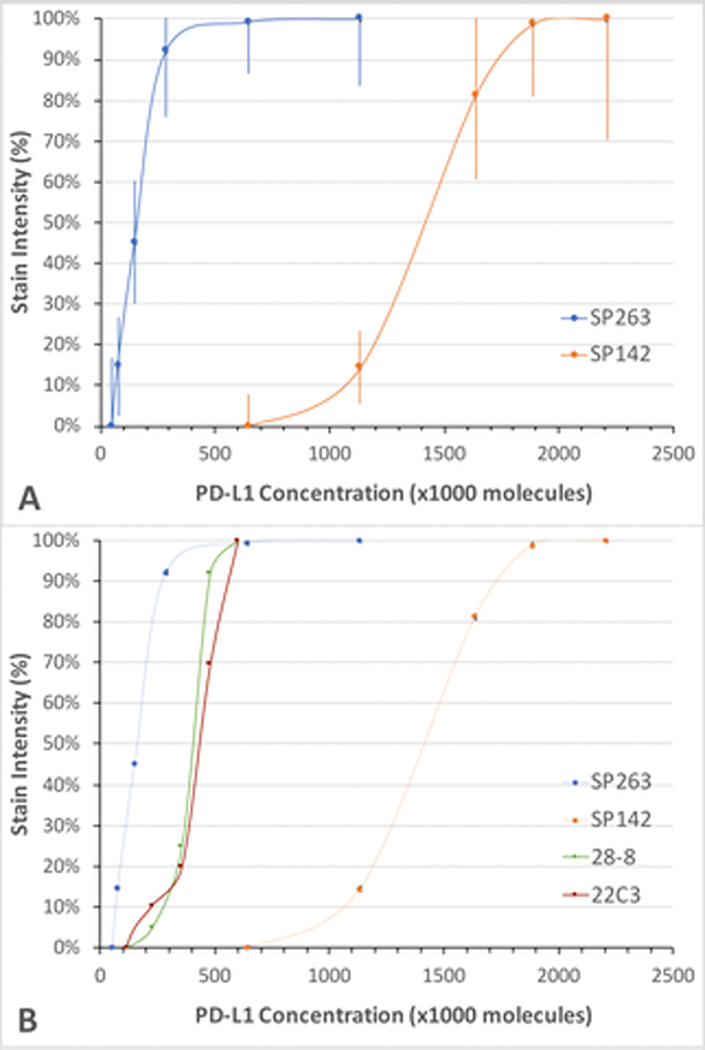
Fig. 4. Consensus analytic response curves of FDA-cleared PD-L1 assays.
In each panel, the stain intensity (y axis) is expressed as a percentage of the maximum stain intensity for each assay and graphed as a function of PD-L1 concentration (x axis). A. Performance characteristics of the VENTANA SP263 and SP142 PD-L1 assays, correlating the generation of visible signal at various PD-L1 concentrations. Each dot is the mean ± SD of the pool of laboratories participating in the survey. B. Performance characteristics of the PharmDx 28–8 and 22C3 PD-L1 assays. For comparison, the analytic response curves shown in panel A are included.

