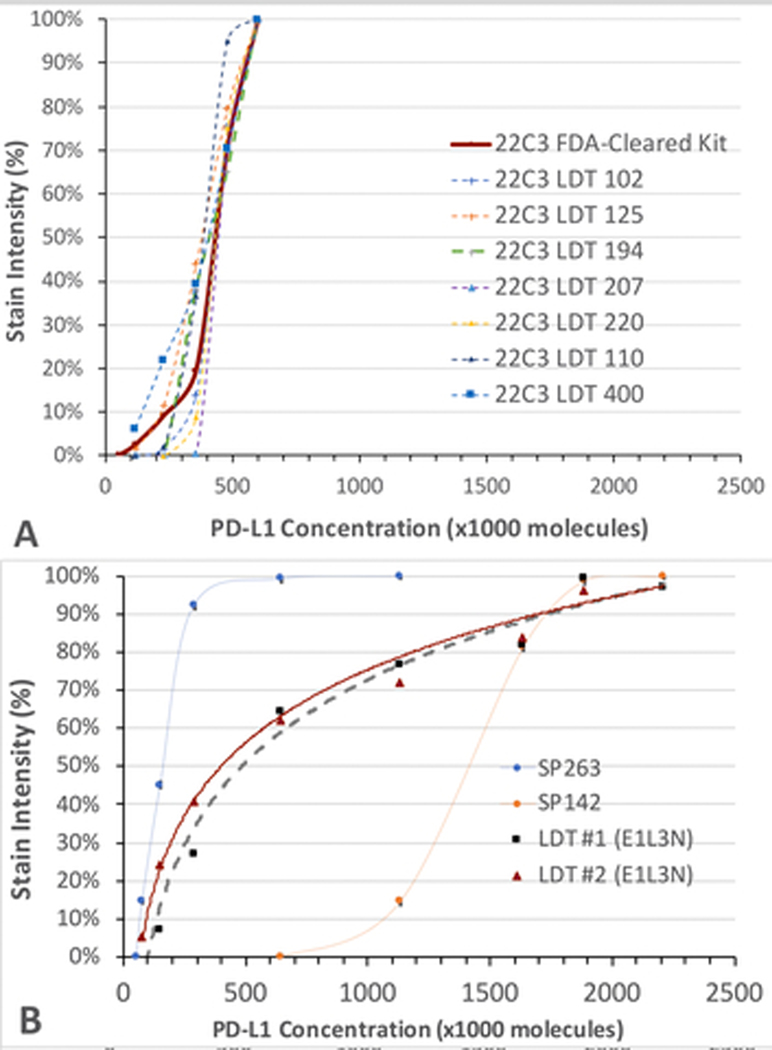
Fig. 5. Individual analytic response curves of PD-L1 LDTs.
Panel A shows 7 LDTs using the 22C3. Panel B shows 2 LDTs using the E1L3N primary antibody. This is the same as the LDTs PD-L1 (E1L3N) in Fig. 2. In each panel, the stain intensity as a percentage of the maximum (y axis) is graphed as a function of PD-L1 concentration (x axis). The FDA-cleared consensus curves are also included as a comparison for the corresponding extra-cellular (panel A) or intracellular (panel B) domain calibrators.

