
Figure 1. Longitudinal trajectories of motor activity by outcome group.
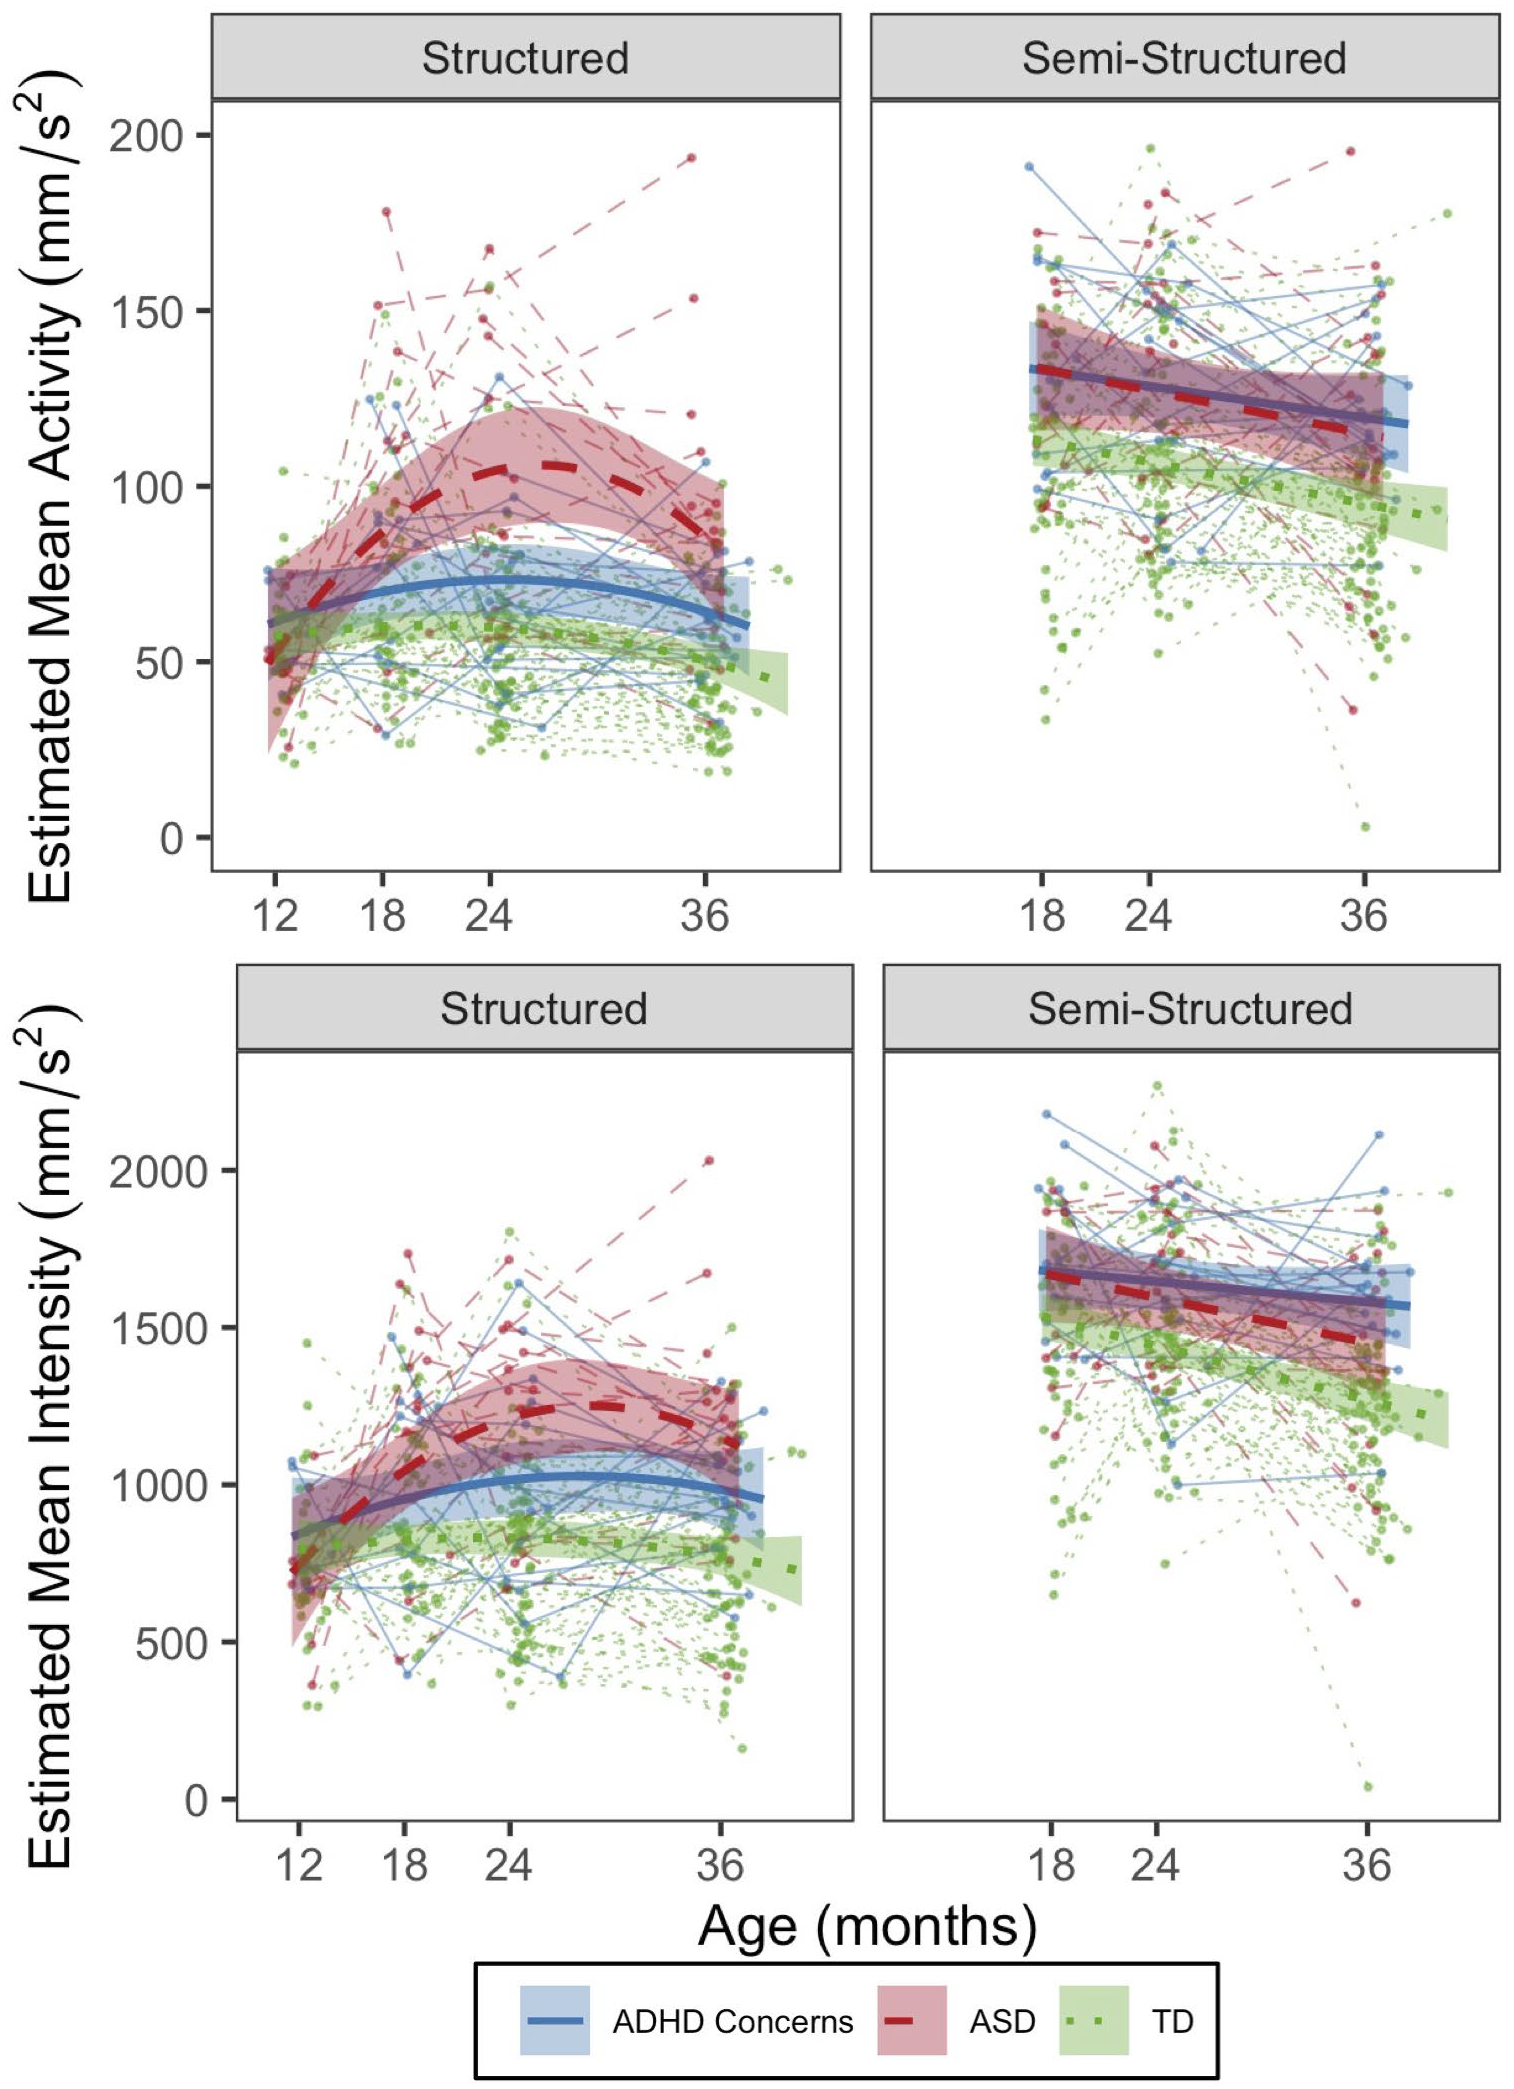
Mean activity (top panel) and mean intensity of activity (bottom panel) by structured (left panel) and semi-structured (right panel) assessment context. Error bands denote 95% Confidence Intervals.