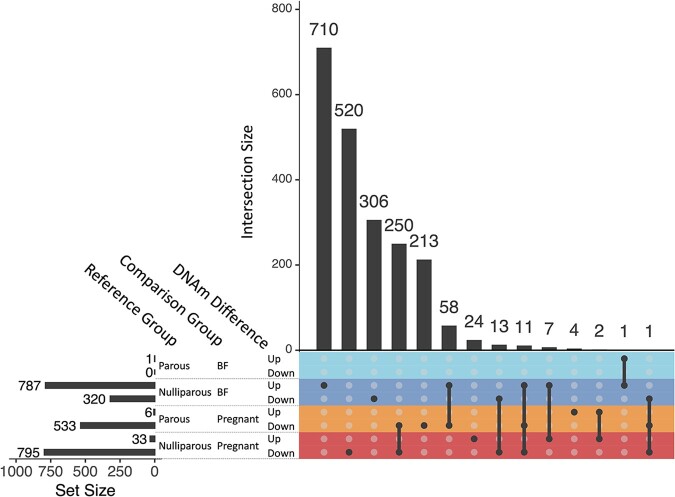
Figure 3.
Upset plot showing overlap of DMPs between women of differing reproductive status
Single points represent distinct DMPs, whereas connected points represent overlapping DMPs between groups. Differences are categorized as up or down methylated relative to the reference group (nulliparous or parous women), with numbers of DMPs for each category are displayed on the top of the graph.

