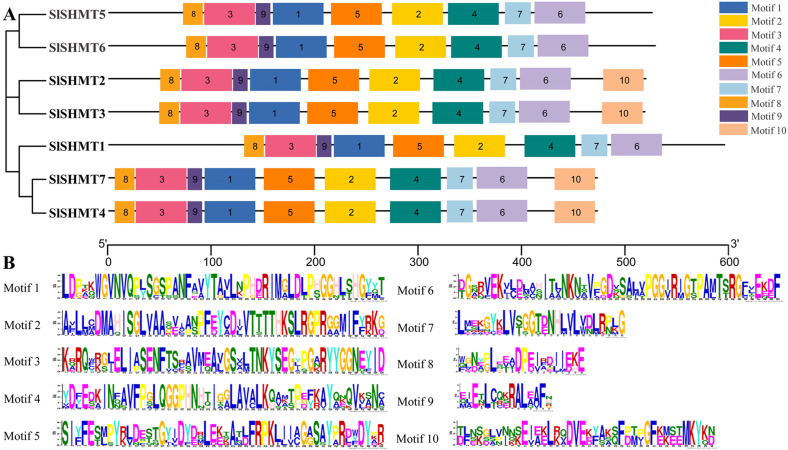
Figure 4. The motif composition and distribution of tomato SHMT proteins.
(A) Colored boxes represent different conserved motifs, and motifs 1-10 are shown in (B). (B) Amino acid sequences of different conserved motifs displayed by stacks of letters at each position. The total height of the stack represents the information content of the relative amino acid in the position of each letter in the motif in bits. The height of the individual letter in a stack is calculated by the probability of the letter at that position times the total information content of the stack. X- and Y-axis represents the width and the bits of each letter, respectively.

