
Figure A3.3.
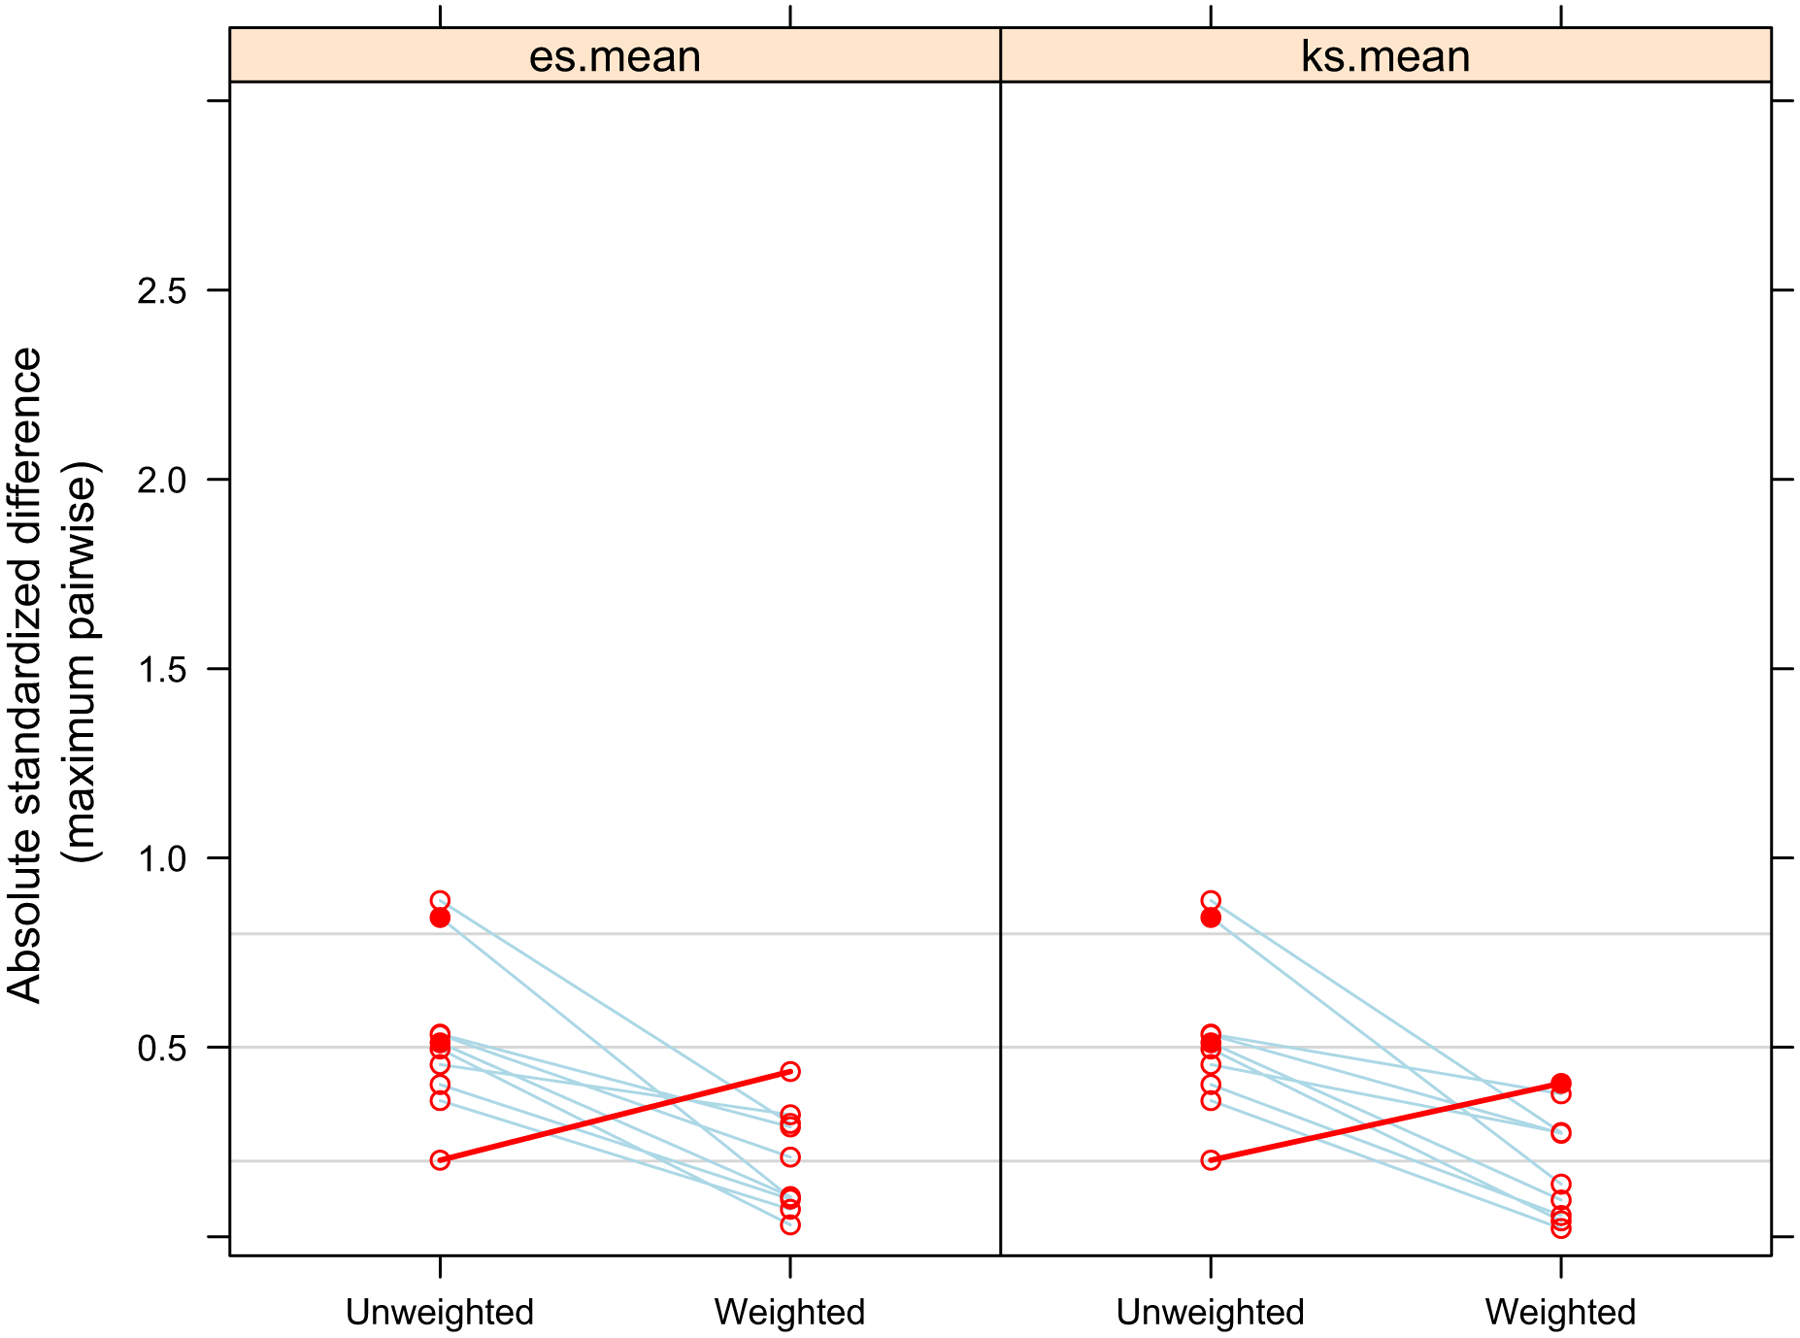
Comparison of Overall Absolute Standardized Mean Difference of Covariates Between Malnutrition Groups Before and After Propensity Score Weighting
Official websites use .gov
A
.gov website belongs to an official
government organization in the United States.
Secure .gov websites use HTTPS
A lock (
) or https:// means you've safely
connected to the .gov website. Share sensitive
information only on official, secure websites.
Comparison of Overall Absolute Standardized Mean Difference of Covariates Between Malnutrition Groups Before and After Propensity Score Weighting