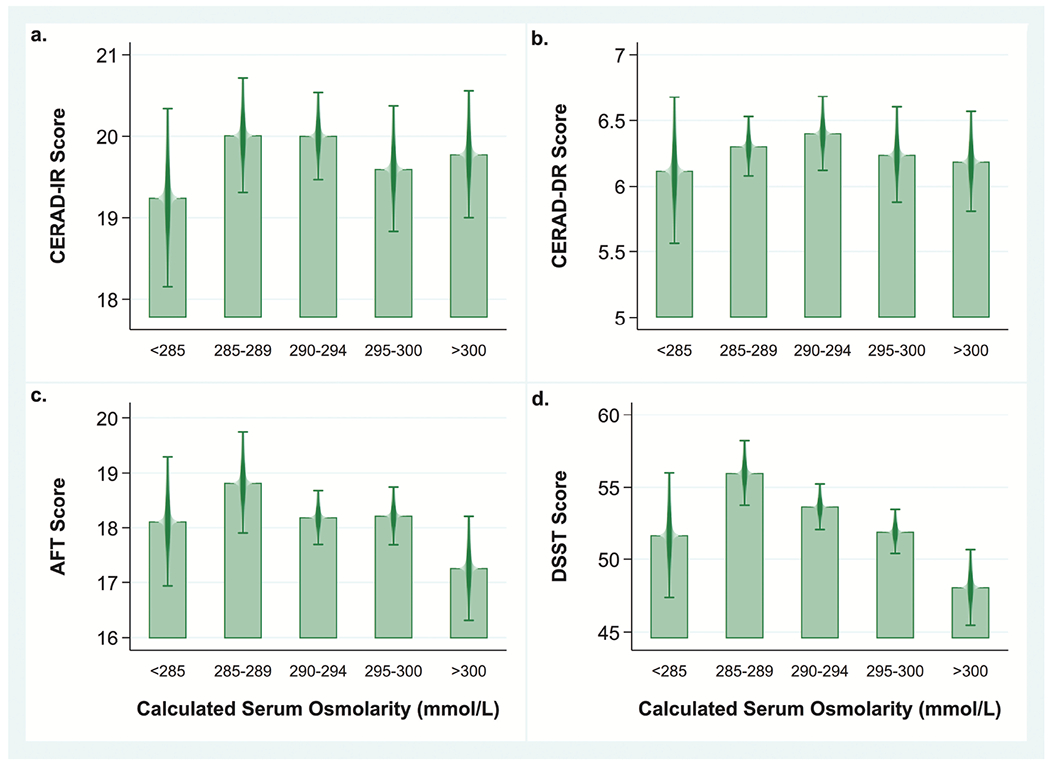
Fig 1.

Mean cognitive tests scores by category of calculated serum osmolarity among US women and men ≥60 years old (n=2,506), NHANES 2011–2014.
Note: Bivariate analyses comparing mean cognitive test scores across the five categories of calculated serum osmolarity (Sosm) using a univariate t statistic at the P< 0.05 significance level not adjusted for covariates.
a. Mean CERAD IR scores for Sosm<285 mmol/L: 19.2±0.5; Sosm 285-289 mmol/L: 20.0±0.3; Sosm 290-294 mmol/L: 20.0±0.3; Sosm 295-300 mmol/L: 19.6±0.4; Sosm >300 mmol/L: 19.8±0.4. No significant differences across Sosm categories.
b. Mean CERAD IR scores for Sosm<285 mmol/L: 6.1±0.3; Sosm 285-289 mmol/L: 6.3±0.1; Sosm 290-294 mmol/L: 6.4±0.1; Sosm 2950-300 mmol/L: 6.2±0.2; Sosm >300 mmol/L:6.2±0.2. No significant differences across Sosm categories.
c. Mean AFT scores for Sosm<285 mmol/L: 18.1±0.6; Sosm 285-289 mmol/L: 18.8±0.5; Sosm 290-294 mmol/L: 18.2±0.2; Sosm 295-300 mmol/L: 18.2±0.3; Sosm >300 mmol/L: 17.3±0.5. AFT scores were significantly lower in the group with Sosm >300 mmol/L compared with the group with Sosm 285-289 mmol/L (−1.6±0.6, p=0.02) and the group with Sosm 295-300 mmol/L (−1.0±0.4, P=0.04).
d. Mean DSST scores Sosm<285 mmol/L: 51.7±2.1; Sosm 285-289 mmol/L: 56.0±1.1; Sosm 290-294 mmol/L: 53.6±0.8; Sosm 295-300 mmol/L: 51.9±0.8; Sosm >300 mmol/L: 48.0±1.3. DSST scores were significantly lower in the group with Sosm >300 mmol/L compared with the group with Sosm 285-289 mmol/L (−7.9±1.4, P<0.001), the group with Sosm 290-294 mmol/L (−5.6±1.3 p<0.001) and the group with Sosm 295-300 mmol/L (−3.8±1.3, p<0.005). They were also lower in the group with Sosm 295-300 compared with the group with Sosm 285-289 mmol/L (−4.1±1.2, P=0.002).
