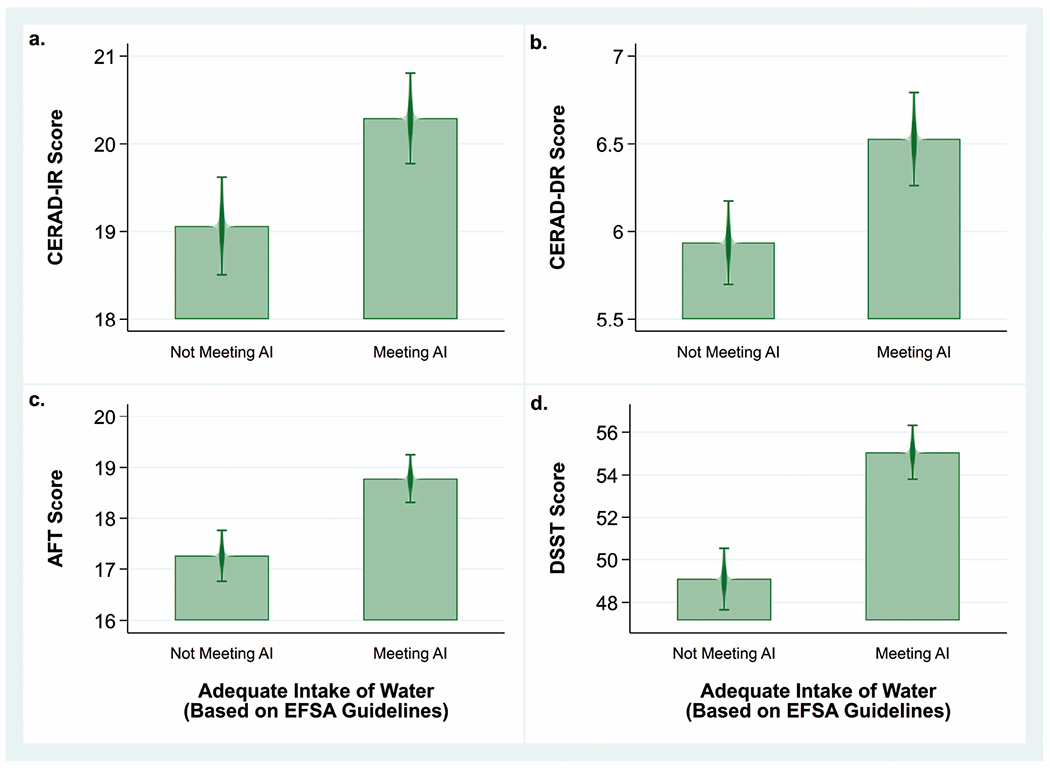
Fig. 2.

Mean cognitive test scores by category of water intake among US women and men ≥60 years old (n=2,506), NHANES 2011–2014.
Note: Bivariate analyses comparing mean cognitive test scores between participants meeting or not meeting EFSA recommendations for adequate intake (AI) of water (≥2 L/day for women and ≥2.5 L/day for men) using a univariate t statistic at the P< 0.05 significance level not adjusted for covariates.
a. Mean CERAD-IR scores among those not meeting AI (19.1±0.3) and meeting AI (20.3±0.3). Difference=1.2±0.2, P<0.001
b. Mean CERAD-DR scores among those not meeting AI (5.9±0.1) and meeting AI (6.5±0.1). Difference=0.6±0.1, P<0.001.
c. Mean AFT scores among those not meeting AI (17.3±0.2) and meeting AI (18.8±0.2). Difference=1.5±0.3, P<0.001.
d. Mean DSST scores among those not meeting AI (49.1±0.7) and meeting AI (55.1±0.6). Difference=6.0±0.7, P<0.001.
