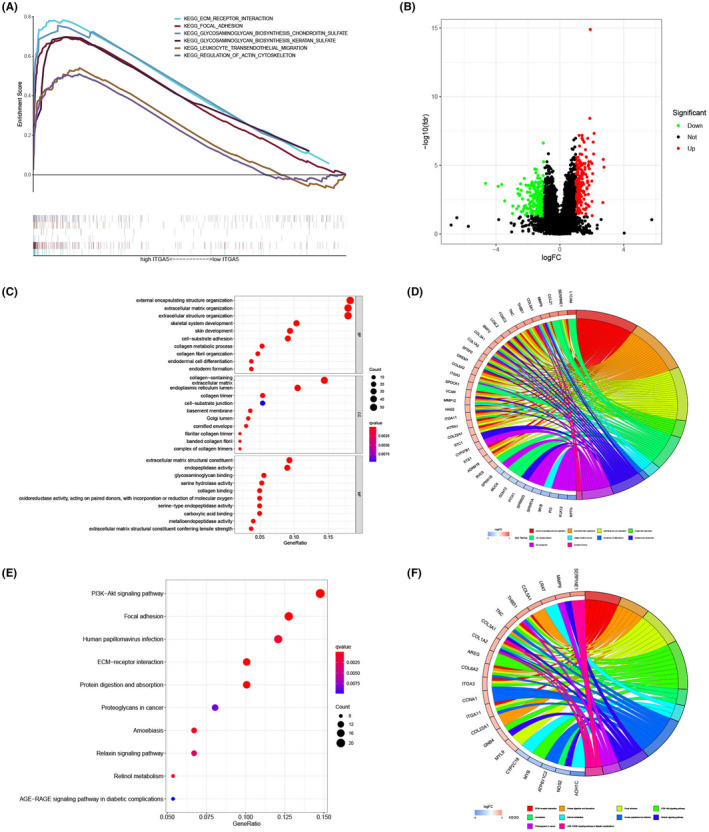
FIGURE 6.

Functional enrichment analysis of ITGA5 in laryngeal squamous cell carcinoma (LSCC). (A) Gene Set Enrichment Analysis (GSEA) between the high‐ITGA5 and the low‐ITGA5 expression groups; (B) Volcano plot of differential expression genes between the high‐ITGA5 and the low‐ITGA5 expression groups; (C) Bubble plot of the GO enrichment analysis; (D) Circos plot of the gene ontology (GO) enrichment analysis; (E) bubble plot of the KEGG enrichment analysis; (F) Circos plot of the KEGG enrichment analysis
