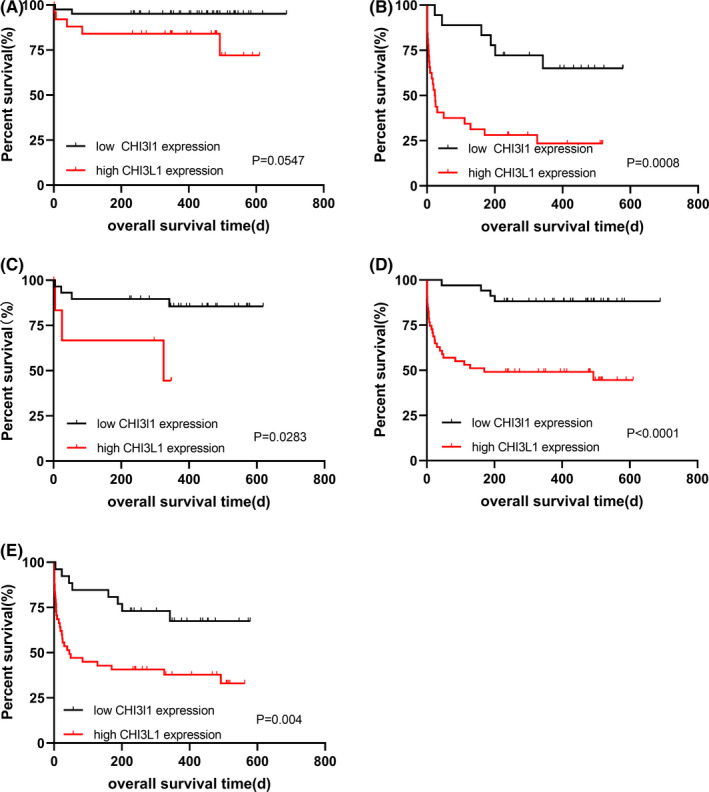
FIGURE 4.

Relationship between the serum CHI3L1 expression level and the prognosis of HCC patients with different characteristics. (A) K‐M curves for OS of HCC patients with low levels of serum AFP; (B) K‐M curves for OS of HCC patients with high levels of serum AFP; (C) K‐M curves for OS of HCC patients without cirrhosis; (D) K‐M curves for OS of HCC patients with cirrhosis; (E) K‐M curves for OS of HCC patients with TNM III + IV stage
