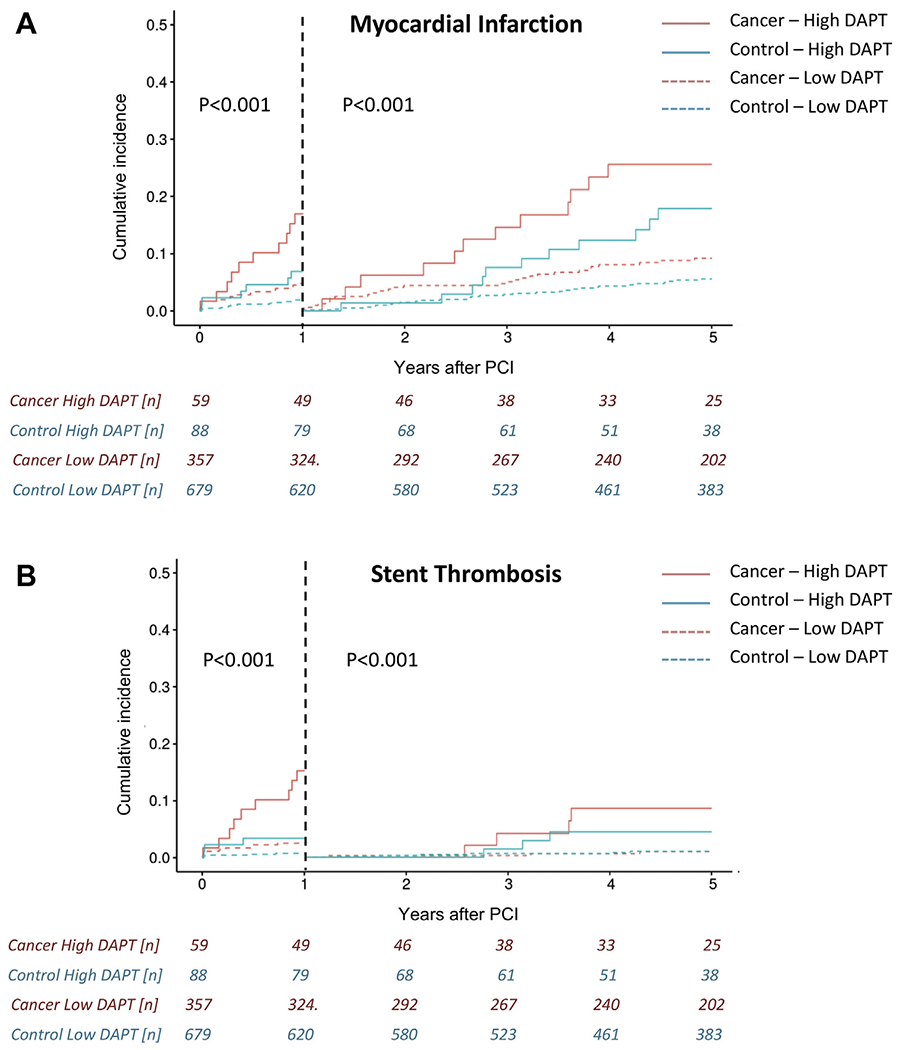
Figure 4.

Landmark analyses for myocardial infarction (top) and stent thrombosis (bottom) by patient group (cancer vs. noncancer) and DAPT score (high vs. low) after PCI. Graphs reflect competing risk cumulative incidences and group comparisons were made by Gray’s test. Abbreviations as in Figure 3.
