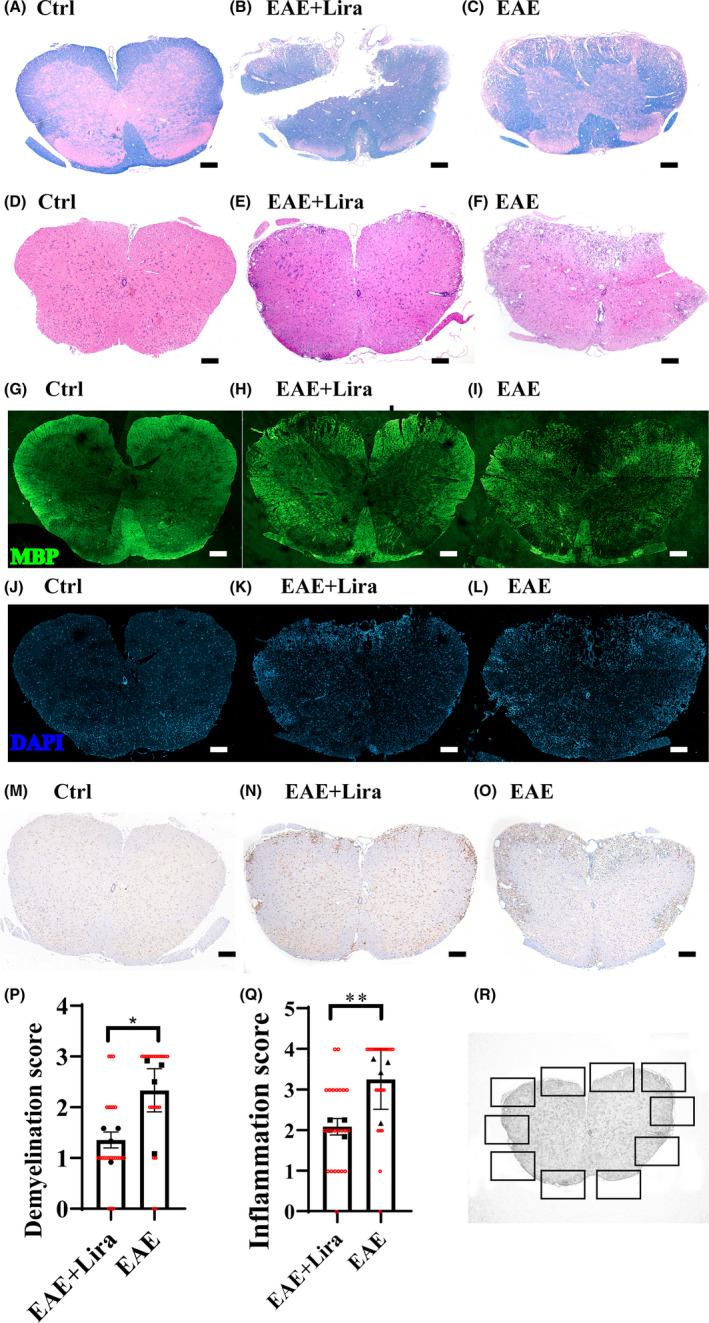
FIGURE 2.

Liraglutide administration ameliorated demyelination and inflammation in lumbar spinal cord of experimental autoimmune encephalitis (EAE) mice. (A–C) shows representative lumbar spinal cord cross section Luxol fast blue (LFB) staining for different groups of mice, which reflects the degree of demyelination. (D–F) shows representative hematoxylin and eosin (HE) staining for different groups, which reflects the degree of inflammatory cell infiltration. (G–I) shows representative myelin basic protein (MBP) immunofluorescence staining for different groups. (J–L) shows representative 4′,6‐diamidino‐2‐phenylindole (DAPI) staining for different groups. (M–O) shows representative ionized calcium‐binding adapter molecule 1 (Iba‐1) immunohistochemical staining for different groups. The scale bar is 200 μm. (P and Q) shows the semi‐quantitative demyelination score (based on LFB staining) and inflammation score (based on HE staining). N = 4 per group. * represents p < 0.05, ** represents p < 0.01. Data were shown in the form of mean ± SEM. The black scatters represent average scores of samples, and the red scatters represent score given by the first observer. (R) Schematic figure to illustrate the process of semi‐quantitative evaluation for LFB and HE staining slices. Six of 10 fields (squares in the picture) were selected randomly by two observers blinded to the grouping information, and the average score was used to represent the extent of demyelination and inflammation for one slice. The inflammation score scale is 0 (normal); 1 (lymphocyte infiltration around meninges and blood vessels); 2 (1–10 lymphocytes in a field); 3 (11–100 lymphocytes in a field); 4 (over 100 lymphocytes in a field). And the demyelination score scale is 0 (normal); 1(small regions of sporadic myelin sheath loss); 2 (a few areas of myelin sheath loss); 3 (massive myelin sheath loss)
