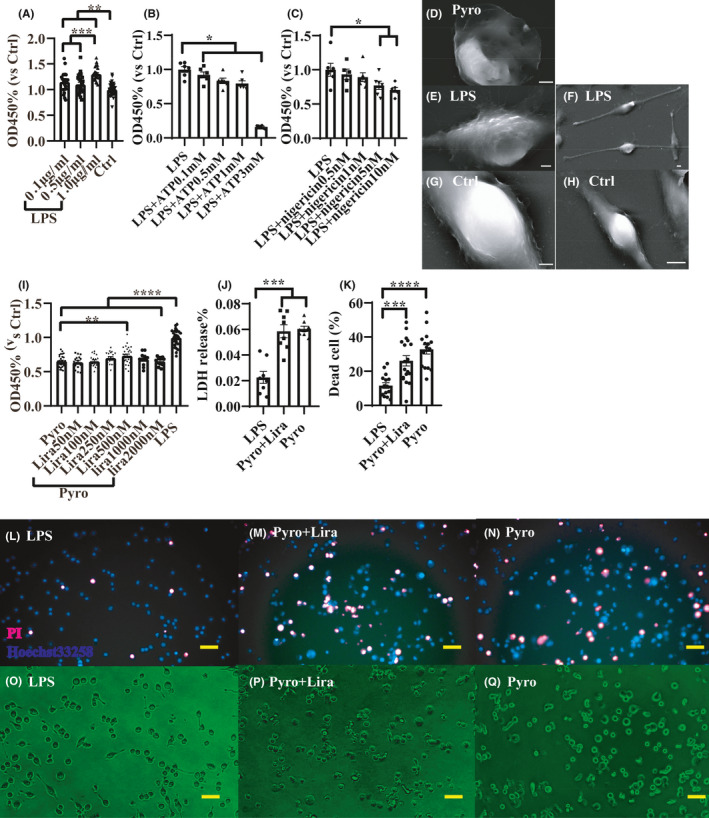
FIGURE 6.

An in vitro microglia pyroptosis model showed that Liraglutide (Lira) could not significantly salvage the cell from pyroptosis. * represents p < 0.05, ** represents p < 0.01, *** represents p < 0.001 and **** represents p < 0.0001. Data were shown in the form of mean ± SEM. (A) shows Cell Counting Kit 8 (CCK8) results after 4 h of gradient concentration lipopolysaccharide (LPS) stimulation (OD450 values were compared with Ctrl group), 1.0 μg/ml LPS manifested most profound stimulation effect and was selected for subsequent experiments. Thus, in (B and C), gradient nigericin and adenosine triphosphate (ATP) were used to incubate with LPS‐primed BV2 cells for 4 h and 2 h, respectively, to induce pyroptosis, and CCK8 test was conducted (OD450 values were compared with LPS‐primed group). (D‐H) shows representative scanning electron microscope pictures of differentially treated cells. D shows a pyroptosis BV2 cell induced by nigericin, which was flattened and pored, E and F shows LPS‐primed cell, which had long projections and rugged activated soma, G and H shows a normal BV2 cell which is not primed by LPS and exhibits shorter projections and soma with smoother surface (scale bar = 5 μm). Then LPS + nigericin was chosen to build the pyroptosis model. (I) shows after incubation of gradient concentrations of Lira for 24 h then induced for pyroptosis, the CCK8 result for different groups (OD450 values were compared with LPS‐primed group). (J) shows the lactate dehydrogenase (LDH) release proportion of different groups and (K) shows dead cell proportion of different groups. (L–N) shows representative PI‐Hoechst33258 staining images of different groups and (O–Q) shows representative phase‐contrast microscope images of different groups (scale bar = 50 μm). After pyroptosis induction, BV2 cell lost projections and turns into a round shape
