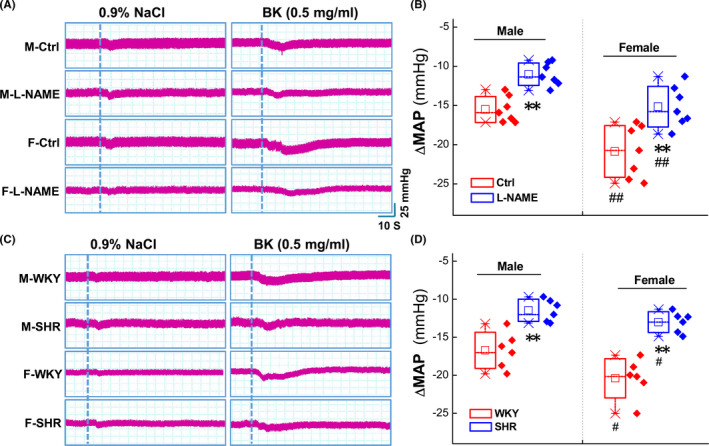
FIGURE 5.

Changes in MAP after microinjection BK into the NG of secondary (L‐NAME) and primary (spontaneously) hypertension model rats. (A) The representative MAP recordings before and after administration with 0.9% NaCl and BK (0.5 mg/ml) in L‐NAME model rats. The dotted line indicates the time of the beginning of treatment. (B) Summarized data for the ΔMAP values after BK microinjection. Averaged data were presented as mean ± SD; **p < 0.01 vs. Ctrl, ## p < 0.01 vs. Male, n = 7 rats. (C) The MAP recordings before and after administration with 0.9% NaCl and BK (0.5 mg/ml) in male and female WKY and SHR rats. The representative MAP recordings after microinjection and the dotted line indicates the time of the beginning of application. (D) Summary data for the ΔMAP values before and after BK microinjection. Data were represented as mean ± SD. **p < 0.05 vs. WKY, # p < 0.05 vs. Male, n = 6
