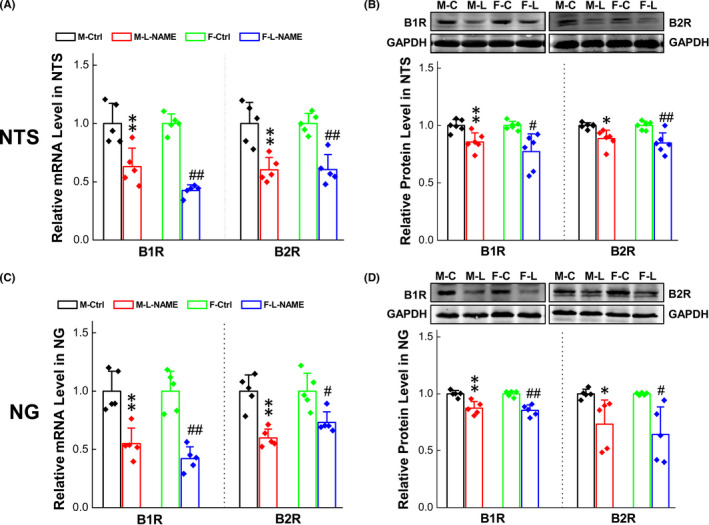
FIGURE 6.

Changes of BRs expression in secondary (L‐NAME) hypertension model rats. (A‐B) B1R/B2R expression changes in mRNA and protein levels at the tissue of NTS and NG in the secondary hypertension model rats. Date were presented as mean ± SD; *p < 0.05 and **p < 0.01vs. M‐Ctrl, # p < 0.05 and ## p < 0.01 vs. F‐Ctrl. (mRNA: n = 4 from 4 rats, protein: n = 5–6 from 10–12 rats)
