
FIGURE 2.
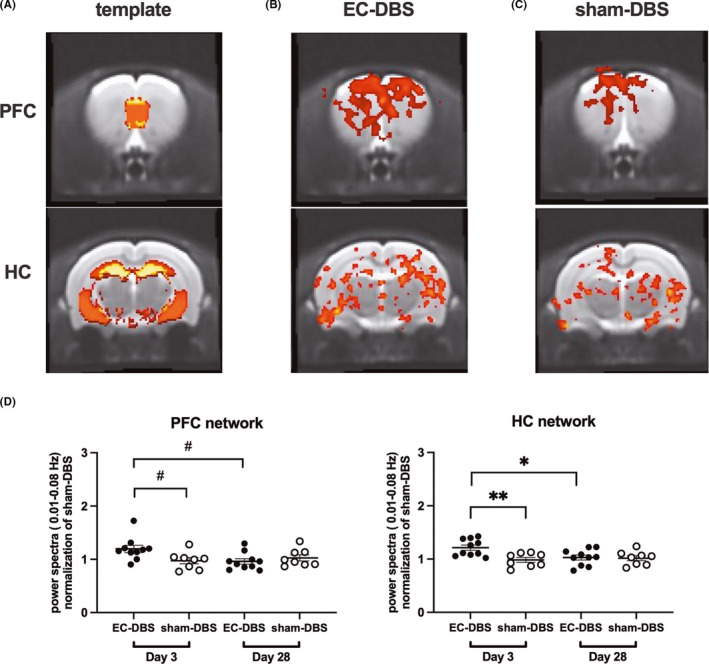
Prefrontal‐ and hippocampal‐related functional networks. (A) The best‐fit components were selected by using the masks of structural PFC and HC. PFC, prefrontal cortex; HC, hippocampus. (B and C) Prefrontal‐ and hippocampal‐related functional network maps of an EC‐DBS and a sham‐DBS rat. D. Power spectra (0.01–0.08 Hz) of the PFC‐ and HC‐related networks in EC‐DBS and sham‐DBS rats 3 days and 28 days after stimulation. Data represented as mean ± S.E. of all points. Multiple Mann‐Whitney tests, #p < 0.05; two‐way ANOVA, *p < 0.05, **p < 0.01