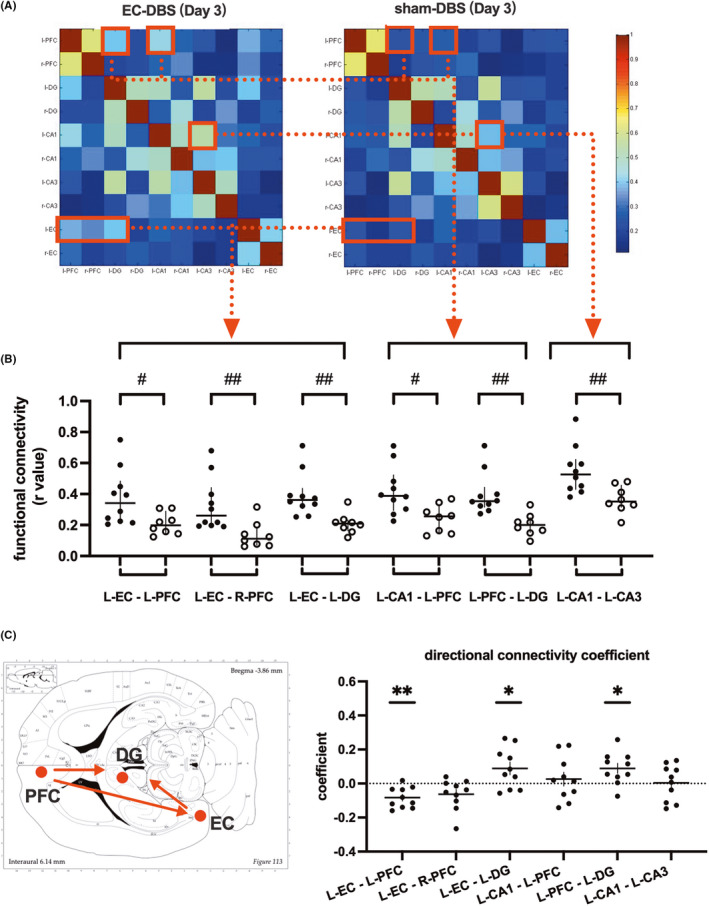
FIGURE 4.

(A) Functional connectivity among brain regions, including the left and right PFC, DG, CA1, CA3 and EC in the EC‐DBS and sham‐DBS group 3 days after stimulation. The color bar indicates mean r‐values. (B) EC‐DBS‐induced functional connectivity changes 3 days after stimulation. Data represented as median with interquartile range of all points. Multiple Mann‐Whitney tests, #p < 0.05, ##p < 0.01. (C) Granger causality analysis revealed the directions of functional connectivity among the left PFC, DG and EC in EC‐DBS rats 3 days after stimulation. Directional connectivity coefficients of seed‐based functional connections are represented as mean ± S.E. of all points. One sample t‐test, *p < 0.05, **p < 0.01
