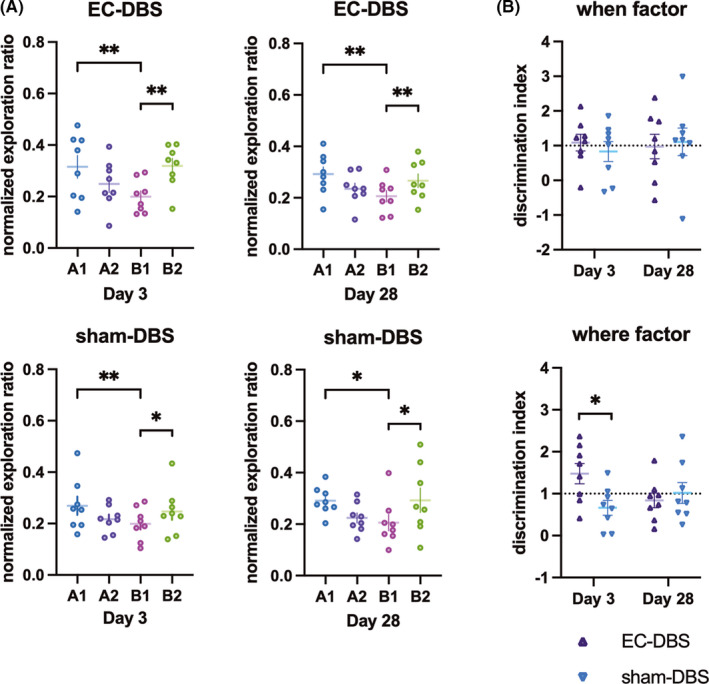
FIGURE 5.

Behavior performance of the animals 3 days and 28 days after stimulation. Normalized exploratory ratio per object in the episodic‐like memory test and the discrimination index (where and when factors) for each group in each test day. Data are represented as mean ± S.E. of all points. *p < 0.05, **p < 0.01
