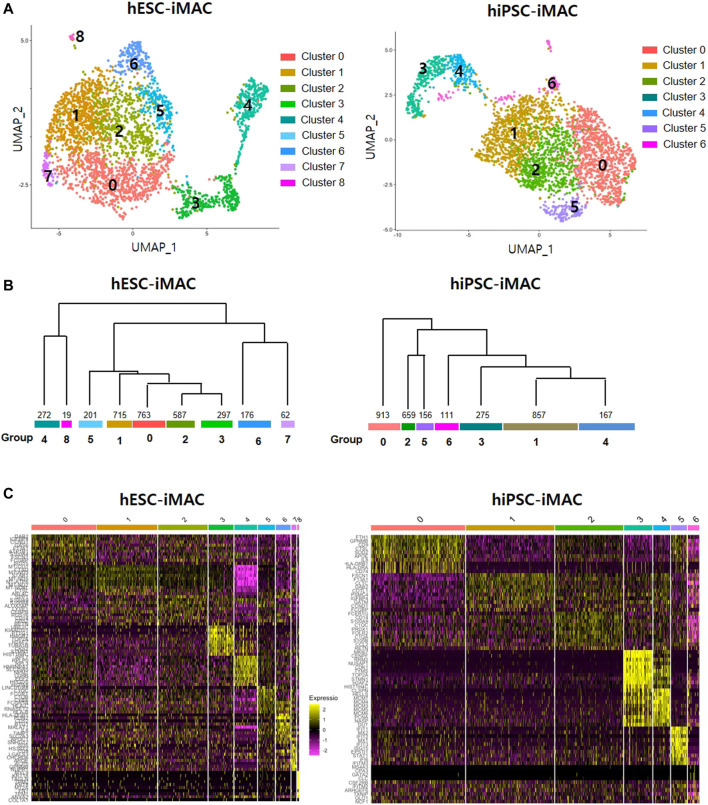
FIGURE 2.
Cellular heterogeneity within the filtered induced macrophages (iMACs) analyzed by Seurat method. In total, 3,092 hESC derived iMACs (hESC-iMAC) and 3,138 hiPSC derived iMAC (hiPSC-iMAC) were analyzed via two-dimensional UMAP analysis to visualize their similarity. (A) The iMACs were grouped into 6 (hESC-iMAC) and 8 (hiPSC-iMAC) clusters. The color codes are as indicated. (B) The dendrogram showing associations among clusters. The bottom of the branch indicates the number of cells in each cluster. (C) Heatmap shows the expression of the top 10 genes of each group.

