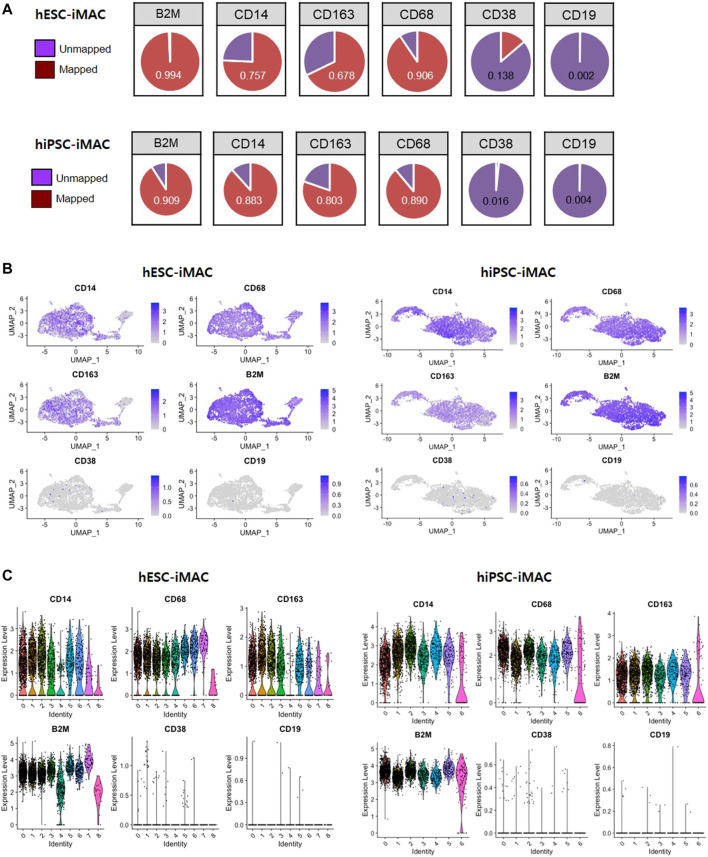
FIGURE 3.
Expression level of known macrophage markers analyzed by Seurat method. (A) The proportion of cells expressing macrophage-positive and macrophage-negative marker genes and the number of mapped genes. Violin and jitter plots and UMAP plots for the expression of (B) macrophage-positive markers (CD14, CD68, CD163, and B2M) and (C) macrophage-negative markers (CD38 and CD19).

