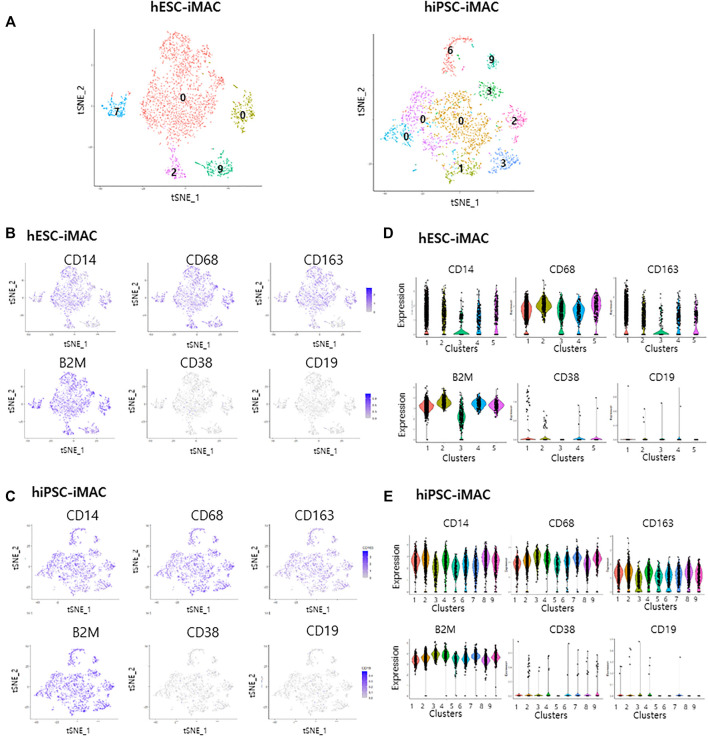
FIGURE 5.
Cellular homogenity within the filtered induced macrophages (iMACs) analyzed by ILOReg methods. In total, 3,092 hESC derived iMACs (hESC-iMAC) and 3,138 hiPSC derived iMAC (hiPSC-iMAC) were analyzed via two-dimensional tSNE analysis to visualize their similarity. (A) Number of DEGs of each cluster (Log2 fold change >1, p < 0.05, exclude mitochondrial genes) in hESC-iMAC (left) and hiPSC-iMAC (right). (B–E) The proportion of cells expressing macrophage-positive and macrophage-negative marker genes and the number of mapped genes. (B,C) tSNE plots and (D,E) violin and jitter plots for the expression of macrophage-positive markers (CD14, CD68, CD163, and B2M) and macrophage-negative markers (CD38 and CD19).

