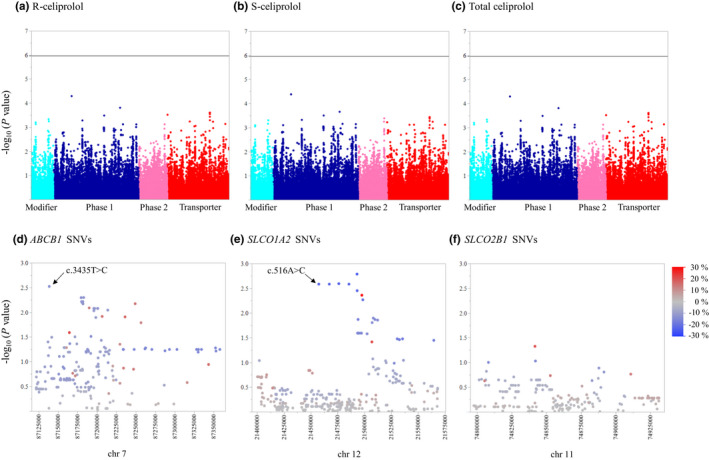
FIGURE 1.

The associations of 46,064 SNVs in 379 pharmacokinetic genes with R‐celiprolol (a), S‐celiprolol (b), and total celiprolol (c) AUC0–∞ adjusting for LBW. The Y‐axes describe the negative logarithm of the p value for each SNV and the horizontal lines indicate the Bonferroni‐corrected significance level of 1.09 × 10⁻⁶. The X‐axes show individual SNVs grouped by protein function. The associations of SNVs (MAF ≥ 0.05) in SLCO1A2 (d), ABCB1 (e), and SLCO2B1 (f) with total celiprolol AUC0–∞. The Y‐axes describe the negative logarithm of the p value for each SNV and the X‐axes show the chromosomal positions (GRCh37/hg19 assembly). The blue to red scale shows the effect size (%) of each SNV per copy of the minor allele. AUC0–∞, area under the plasma concentration‐time curve from 0 to infinity; LBW, lean body weight; MAF, minor allele frequency; SNV, single nucleotide variation
