
FIGURE 3.
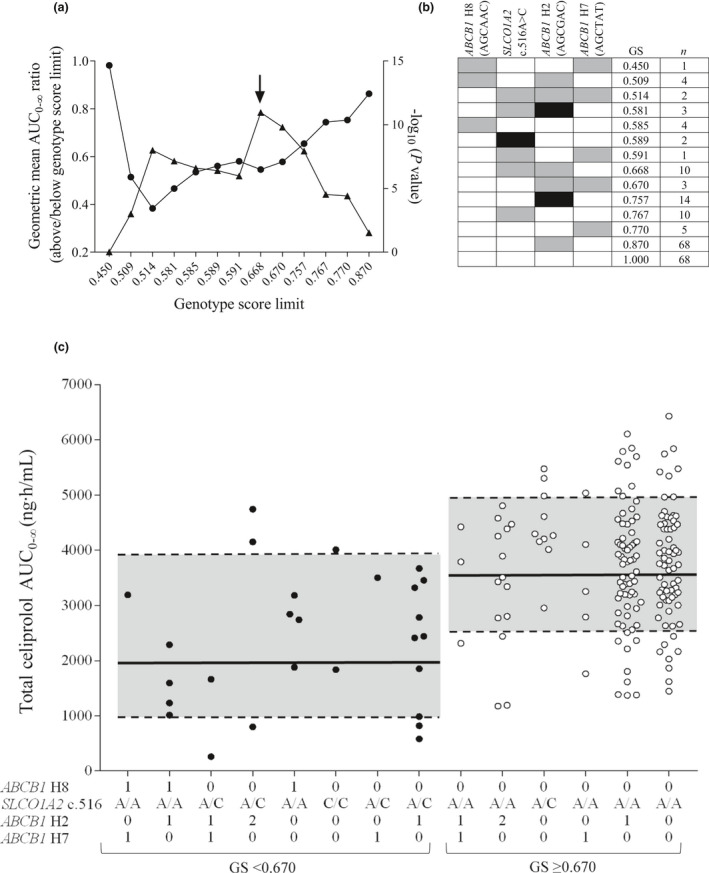
Associations of total celiprolol AUC0–∞ with genotype scores calculated with SLCO1A2 c.516A>C and ABCB1 haplotypes. (a) The total celiprolol geometric mean AUC0–∞ ratios between groups below and above each genotype score limit (circles) and respective p values (triangles). The arrow depicts the optimal cutoff value. (b) Genotype scores (GS) for individuals with different genotype combinations. ABCB1 and SLCO1A2 reference genotypes are depicted with white, heterozygous with gray, and homozygous variant genotypes with black rectangles. (c) The LBW‐adjusted AUC0–∞ values of total celiprolol grouped by genotype scores. The 0, 1, and 2 indicate the number of ABCB1 haplotype copies. The black lines in the gray areas depict the geometric mean and dashed lines the ± geometric SD AUC0–∞ values for genotype score groups below and above the cutoff limit. AUC0–∞, area under the plasma concentration‐time curve from 0 to infinity; LBW, lean body weight